Geoportal for Mineral Exploration
FROM DATA TO DISCOVERY
In modern mineral exploration, the speed and accuracy of decision-making determine success. Scattered data, the high cost of fieldwork, and the need to rapidly assess promising areas are challenges every team faces—from the independent geologist to the major mining corporation.
We have created a professional geoportal that turns these challenges into your competitive advantages. This isn't just a map; it's a powerful analytical tool built by geologists for geologists, investors, and industry experts.
Stop spending months gathering data—start analyzing it in minutes.
Key Benefits for Your Business:
⚡ Radically Reduce Time and Costs
Gain instant access to analysis-ready geophysical, geochemical, geological, and terrain data. Cut expenses on the preliminary assessment of license blocks and prospective areas.
🔍 In-Depth Analysis and Pattern Recognition
Overlay and compare dozens of layers—from magnetic anomalies to soil chemistry—to uncover subtle indicators of mineralization that are impossible to see with disparate maps.
📊 Data-Driven Decision-Making
Provide your investors and management with clear, visual analytics to justify investments. Quickly evaluate the potential of new assets without engaging costly external expertise at the early stages.
👥 Accessibility for Teams of Any Size
We provide tools, once available only to large corporations, to small exploration companies, independent consultants, and individual prospectors.
Functionality Built to Solve PRACTICAL CHALLENGES
Our intuitive interface allows you to focus on analysis, not on learning complex software.
Interactive Viewer with Key Data Layers
- Geophysics: Magnetic (EMAG2 v3) and gravity (WGM2012) anomalies
- Terrain Analysis: Digital Elevation Models (DEM) and derived layers (slopes, TPI, TRI, MTPI, flow accumulation zones)
- Geology and Tectonics: Geological maps, lithology, and fault structures
- Geochemistry: Chemical and particle size composition of soils (SoilGrids)
- Deposit Databases: Known deposits and mineral occurrences (MRDS, USGS)
Advanced Analysis Tools
- Multi-Layer Analysis: Overlay an unlimited number of layers to find spatial correlations
- Custom Data Integration: Upload your own vector data (plot boundaries, sample points) to analyze within the context of global datasets
- Essential Tools: Measure distances and areas, get precise attributes with a click on the map
- Export Capabilities: Export finished maps to PDF for reports and presentations
Who Is This Service FOR?
We built this tool for a wide range of professionals in the natural resource sector:
🔍 Exploration Geologists & Individual Prospectors
Searching for new promising sites with professional-grade tools
🏢 Exploration & Mining Companies
Seeking to optimize processes and reduce risks in mineral exploration
💰 Investors & Analysts
Evaluating the potential of mining projects with data-driven insights
🏛️ Government & Academic Organizations
Involved in the study and management of mineral resources
Beholder Portal Overview
Welcome to Beholder, your premier source for cutting-edge geological map layers designed to meet the diverse needs of geologists, students, and industry professionals. We provide high-quality, detailed, and accessible geospatial data that empowers users to explore, analyze, and understand the Earth’s subsurface in unparalleled depth and detail.
🚀 Get Started | 💎 View Plans
🎯 Who We Serve
🎓 Students & Educators
Access essential geological insights perfect for enhancing curriculum and foundational learning
🔬 Researchers
Conduct academic research with precise, continuously updated geological data
⛏️ Industry Professionals
Plan mining operations and make critical decisions with specialized, high-resolution data
🏆 Our Commitment to Quality
👨🔬 Expert Curation
Meticulously curated by experienced geologists and data scientists
🔄 Continuous Updates
Always receive the most current and precise information available
🚀 Cutting-Edge Technology
Leveraging state-of-the-art technology and extensive field data
⭐ Industry Standards
Exceeding industry standards for successful project outcomes
📚 Quick Start Guide
- Quick Start Guide - Get up and running with the platform in minutes
- User Guide for Geologists - Comprehensive guide for professional geologists
- Interactive Maps - Master the mapping and visualization tools
- AI Models - Understand our machine learning capabilities
Platform Architecture
The Beholder Portal is built on a modern, scalable architecture:
- Frontend: React-based interactive interface
- Backend: Cloud-based processing and storage
- AI Engine: TensorFlow-based machine learning models
- Data Sources: Integration with multiple satellite and geological data providers
- Security: Enterprise-grade security and data protection
Support and Resources
- Documentation: Comprehensive wiki and user guides
- Training: Video tutorials and webinars
- Support: 24/7 technical support
- Community: User forum and knowledge sharing
Next Steps
Ready to start exploring? Check out our Quick Start Guide to get up and running with the platform in minutes.
Quick Start Guide
Introduction
Welcome to Beholder, your premier source for cutting-edge geological map layers designed to meet the diverse needs of geologists, students, and industry professionals. At Beholder, we are dedicated to providing high-quality, detailed, and accessible geospatial data that empowers users to explore, analyze, and understand the Earth’s subsurface in unparalleled depth and detail. Whether you’re conducting academic research, planning a mining operation, or simply expanding your geological knowledge, our comprehensive map layers are tailored to support your endeavors with precision and reliability.
Our offerings include both paid and free map layers, ensuring that everyone from budding geologists to seasoned experts can access the information they need. Our free layers provide essential geological insights, perfect for students and educators looking to enhance their curriculum or for professionals requiring quick, foundational data. For those seeking more specialized information, our premium layers offer advanced features, including high-resolution data, intricate geological structures, and specialized overlays that are indispensable for detailed analysis and decision-making in geological and mining projects.
At Beholder, we understand that accurate geospatial data is crucial for effective planning and risk management in geological and mining industries. Our map layers are meticulously curated and continuously updated by a team of experienced geologists and data scientists, ensuring that you receive the most current and precise information available. We leverage state-of-the-art technology and extensive field data to deliver map layers that not only meet but exceed industry standards, providing you with the tools necessary to drive successful outcomes in your projects.
Step 1: Account Setup
Create Your Account
- Visit the Beholder Portal
- Click “Sign Up” and choose your account type:
- Individual: For geologists, researchers, and consultants
- Team: For exploration companies and organizations
- Enterprise: For large mining companies and institutions
Complete Your Profile
-
Personal Information: Name, email, and contact details
-
Professional Background: Select your specialization:
- Geologist
- Geodesist
- Mining Engineer
- Exploration Manager
- Investor
- Other
-
Verification: Upload professional credentials for verification (optional but recommended)
Step 2: Platform Tour
Interactive Tutorial
- Welcome Screen: Complete the 5-minute interactive tour
- Feature Overview: Learn about key platform features
- Sample Project: Explore a pre-loaded sample project
- Tool Introduction: Get familiar with analysis tools
Dashboard Overview
- Recent Projects: Quick access to your recent work
- Data Library: Your uploaded datasets and maps
- AI Predictions: Latest mineral predictions for your areas
- Notifications: Updates and alerts
Step 3: Create Your First Project
Project Setup
- New Project: Click “Create New Project”
- Project Details:
- Name: “My First Exploration Project”
- Description: Brief description of your exploration goals
- Area of Interest: Draw or upload your area boundary
- Mineral Focus: Select minerals of interest
Define Your Area
- Map Interface: Use the interactive map to define your area
- Drawing Tools: Draw polygons, circles, or upload shapefiles
- Coordinate Systems: Choose appropriate coordinate system
- Area Validation: Confirm your area is correctly defined
Step 4: Explore AI Predictions
View Mineral Predictions
- Layer Panel: Open the layer control panel
- Mineral Layers: Enable mineral prediction layers
- Confidence Settings: Adjust confidence thresholds
- Visualization: Explore different visualization options
Understanding Predictions
- High Confidence (80-100%): Strong indicators, prioritize for field work
- Medium Confidence (60-80%): Moderate indicators, requires verification
- Low Confidence (40-60%): Weak indicators, low priority
- Very Low Confidence (<40%): Insufficient data
Step 5: Analyze Your Data
Basic Analysis Tools
- Measurement Tools: Measure distances and areas
- Annotation Tools: Add notes and markers
- Cross-Sections: Create geological cross-sections
- Statistics: View statistical summaries
Data Integration
- Upload Data: Import your existing geological data
- Format Support: Shapefile, KML, GeoTIFF, CSV
- Data Validation: Automatic validation and error checking
- Layer Management: Organize and manage your data layers
Step 6: Generate Reports
Create Your First Report
- Report Builder: Access the report generation tool
- Template Selection: Choose from available templates
- Content Customization: Add your analysis and findings
- Export Options: PDF, Word, or PowerPoint formats
Report Contents
- Executive Summary: High-level project overview
- Map Visualizations: Key maps and visualizations
- Statistical Analysis: Data analysis and statistics
- Recommendations: Next steps and recommendations
Step 7: Collaborate and Share
Team Collaboration
- Invite Team Members: Add colleagues to your project
- Permission Settings: Control access levels
- Comment System: Add comments and discussions
- Version Control: Track changes and updates
Sharing Options
- Public Sharing: Share with external stakeholders
- Secure Links: Generate secure sharing links
- Export Data: Export data for external use
- API Access: Programmatic access to your data
Common Use Cases
For Geologists
- Mineral Exploration: Identify potential mineral deposits
- Field Planning: Plan field work and sampling
- Data Analysis: Analyze geological and geochemical data
- Report Writing: Generate professional reports
For Geodesists
- Survey Planning: Plan survey campaigns
- Coordinate Systems: Work with multiple coordinate systems
- Precision Mapping: High-precision mapping and measurements
- Data Integration: Integrate survey data with geological data
For Exploration Companies
- Project Management: Manage multiple exploration projects
- Team Coordination: Coordinate team activities
- Investment Analysis: Analyze investment opportunities
- Risk Assessment: Assess exploration risks
Tips for Success
Best Practices
- Start Small: Begin with a small area to learn the platform
- Use Tutorials: Complete all available tutorials
- Join Community: Participate in user forums and discussions
- Regular Updates: Keep your data and analysis updated
Common Mistakes to Avoid
- Incorrect Area Definition: Ensure your area is properly defined
- Ignoring Confidence Scores: Always consider prediction confidence
- Skipping Validation: Validate AI predictions with geological knowledge
- Poor Data Quality: Ensure your input data is clean and accurate
Getting Help
Support Resources
- Documentation: Comprehensive online documentation
- Video Tutorials: Step-by-step video guides
- Webinars: Regular training webinars
- Support Team: 24/7 technical support
Community
- User Forum: Connect with other users
- Knowledge Base: Searchable knowledge base
- Case Studies: Learn from successful projects
- Best Practices: Industry best practices and guidelines
Next Steps
Advanced Features
- Custom Models: Train custom AI models
- API Integration: Integrate with external software
- Advanced Analytics: Use advanced statistical tools
- 3D Visualization: Explore 3D geological models
Professional Development
- Certification: Earn professional certifications
- Training Programs: Advanced training programs
- Research Collaboration: Participate in research projects
- Conference Participation: Attend user conferences
Troubleshooting
Common Issues
- Login Problems: Check your credentials and internet connection
- Slow Performance: Ensure you have a stable internet connection
- Data Upload Issues: Check file formats and sizes
- Map Display Problems: Clear browser cache and refresh
Getting Support
- Help Center: Search the help center for solutions
- Contact Support: Submit a support ticket
- Live Chat: Use live chat for immediate help
- Phone Support: Call our support team
Conclusion
Congratulations! You’ve completed the quick start guide and should now have a basic understanding of the Beholder Portal. Continue exploring the platform and don’t hesitate to reach out for support if you need help.
Ready to dive deeper? Check out our comprehensive documentation or explore our user guides for your specific role.
Interactive Maps and Visualization
The Beholder Portal’s interactive mapping system is the core of our mineral exploration platform. This guide will help you master all the mapping features and visualization tools available.
Map Interface Overview
Main Map Components
- Map Canvas: The central interactive map display
- Layer Panel: Control which data layers are visible
- Toolbar: Access to mapping and analysis tools
- Info Panel: Display detailed information about selected features
- Scale Bar: Map scale and coordinate information
Navigation Controls
- Zoom: Mouse wheel or zoom buttons
- Pan: Click and drag to move around the map
- Rotation: Ctrl + drag to rotate the map view
- Reset View: Return to default view and orientation
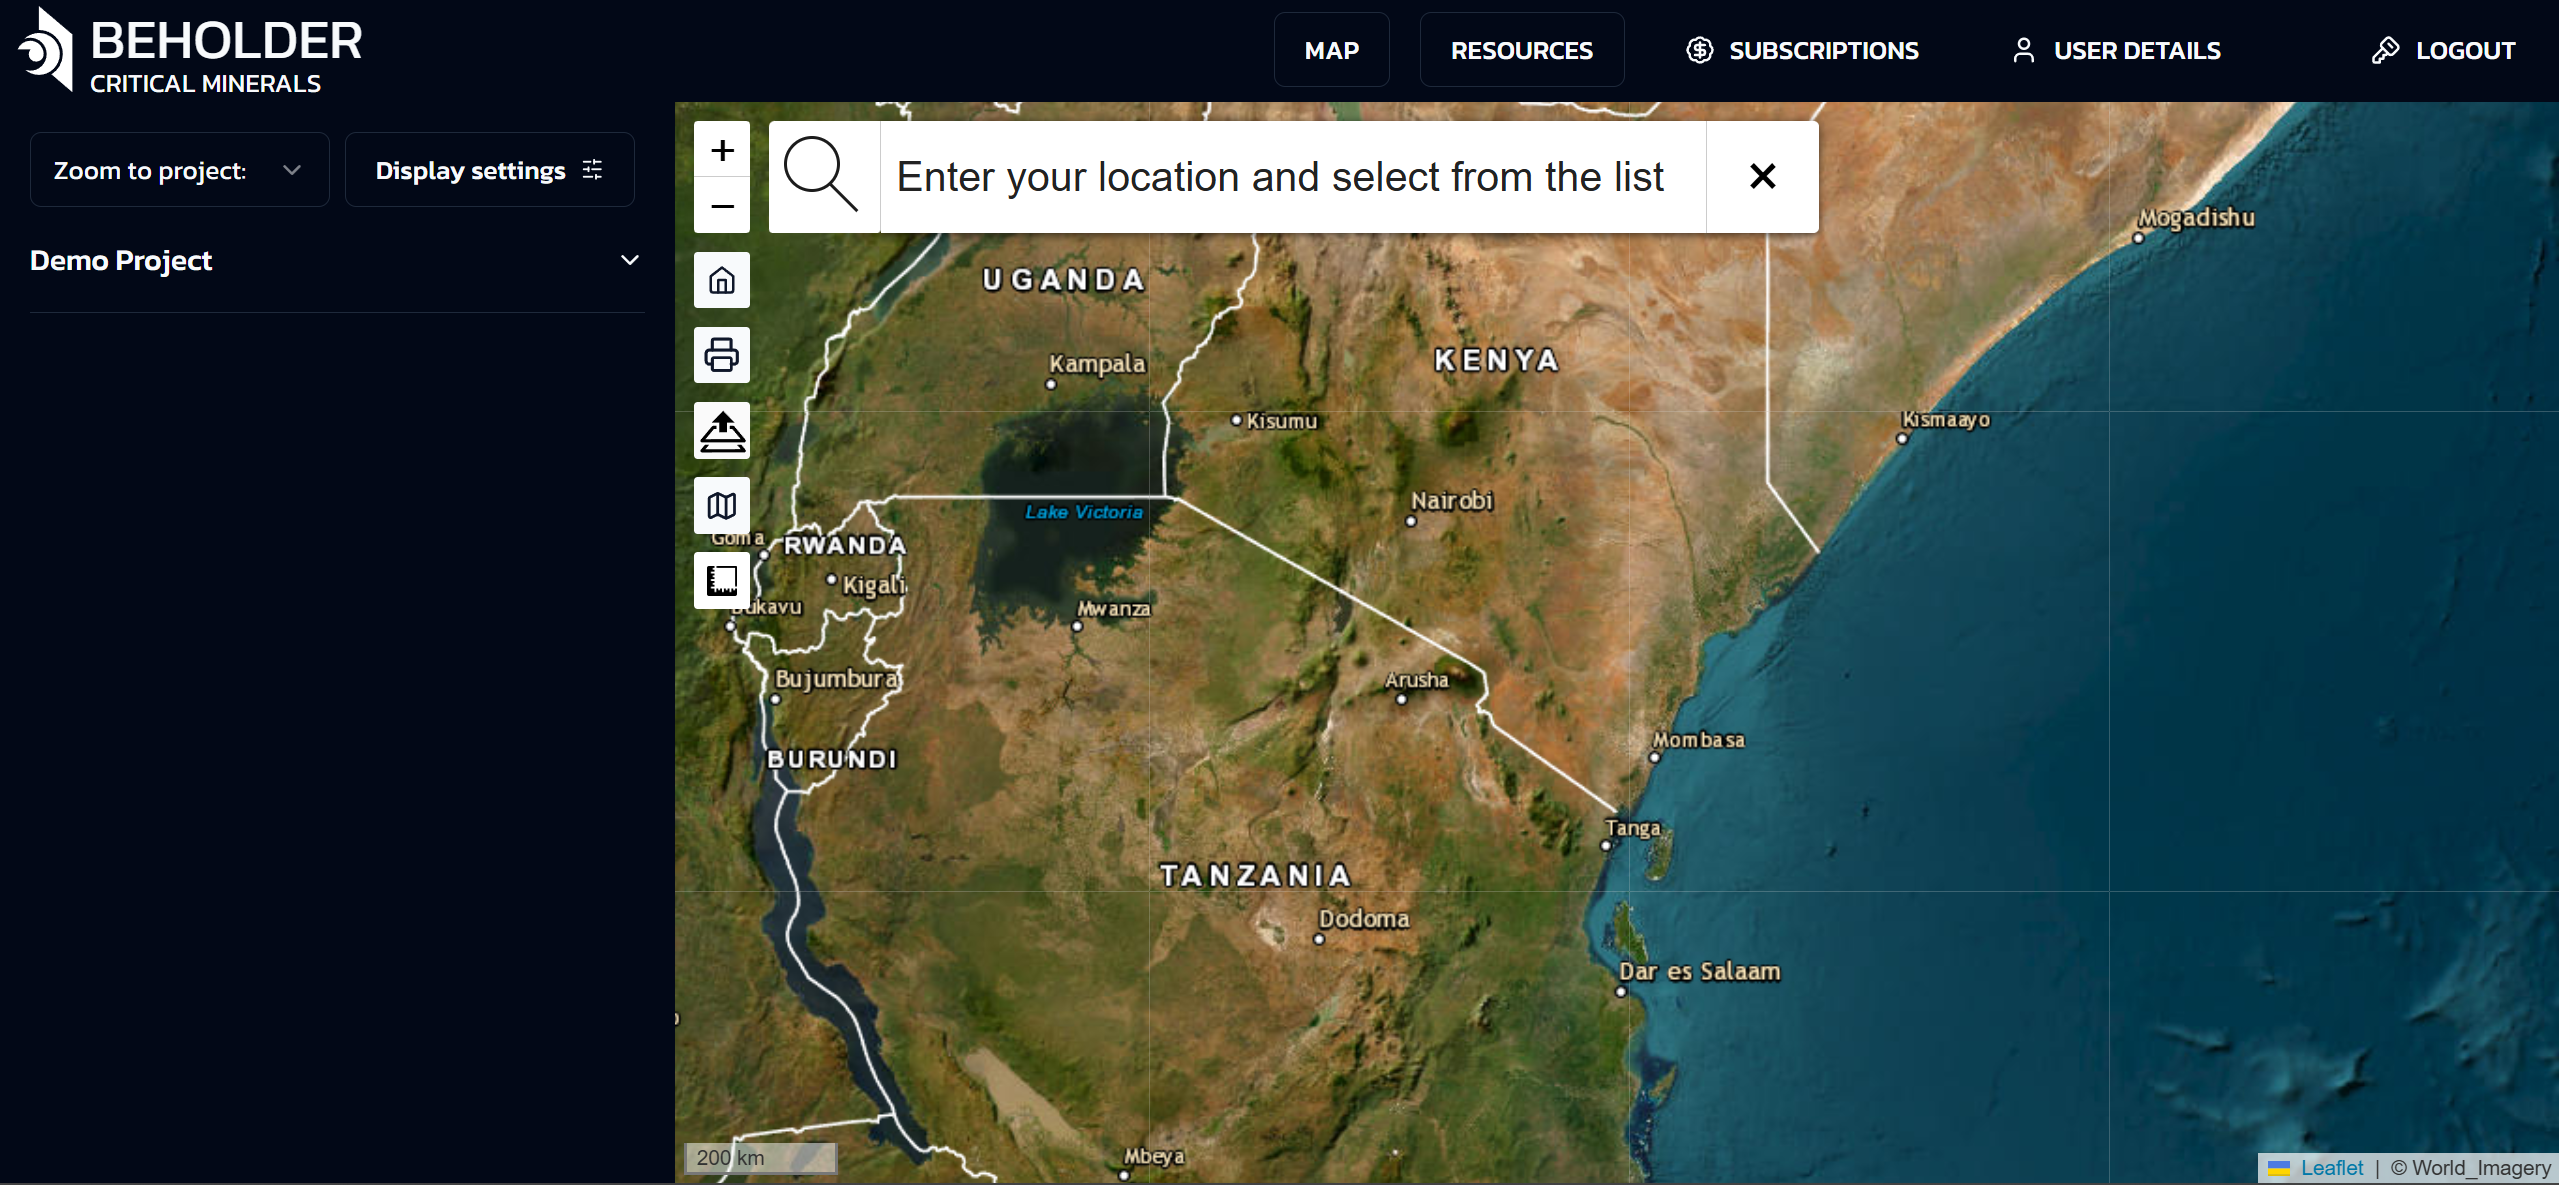
Top Navigation Bar
MAP Button
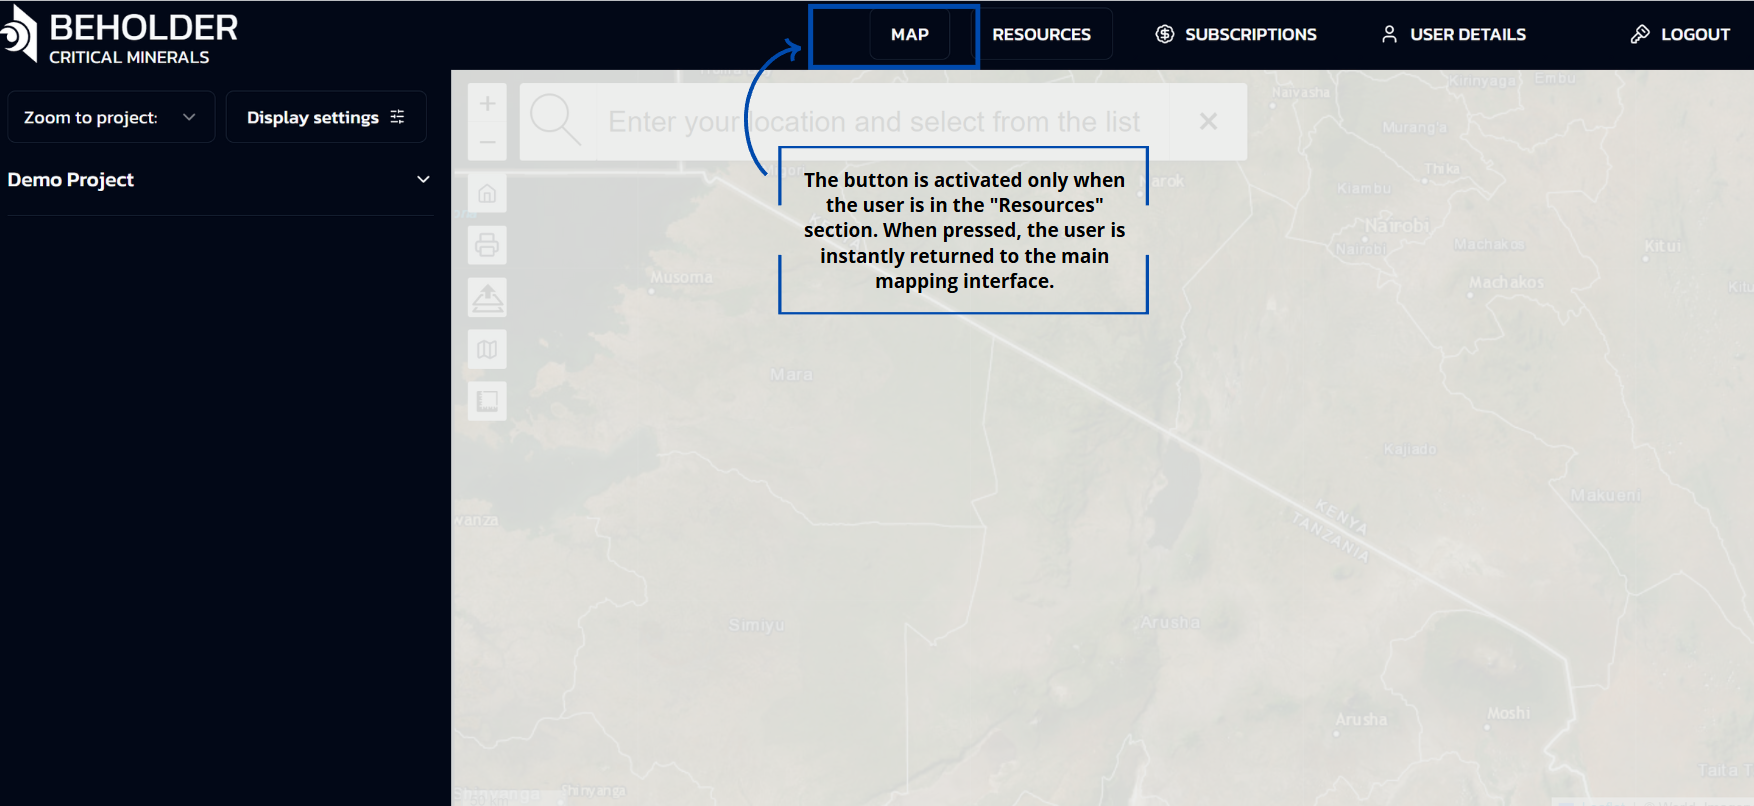 The Home button is designed to perform one specific function: returning the user to the main screen of the application only from the “Resources” section.
Return from the “Resources” section: The button is activated only when the user is in the “Resources” section. When clicked, it instantly returns the user to the main cartography screen.
RESOURCES Button
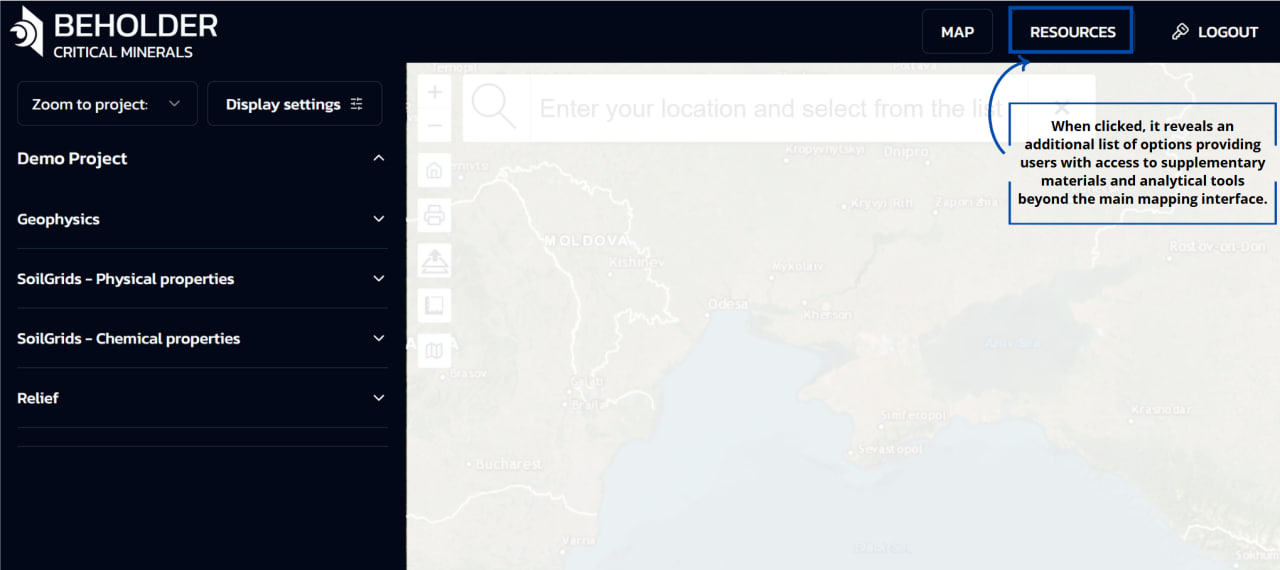
- Expands into a dropdown menu
- Provides access to:
- Geological data library
- Analytical reports
- Technical documentation
- Training materials
Detailed information about the contents and functionality of the Resources section can be found in the Resources documentation.
LOGOUT Button
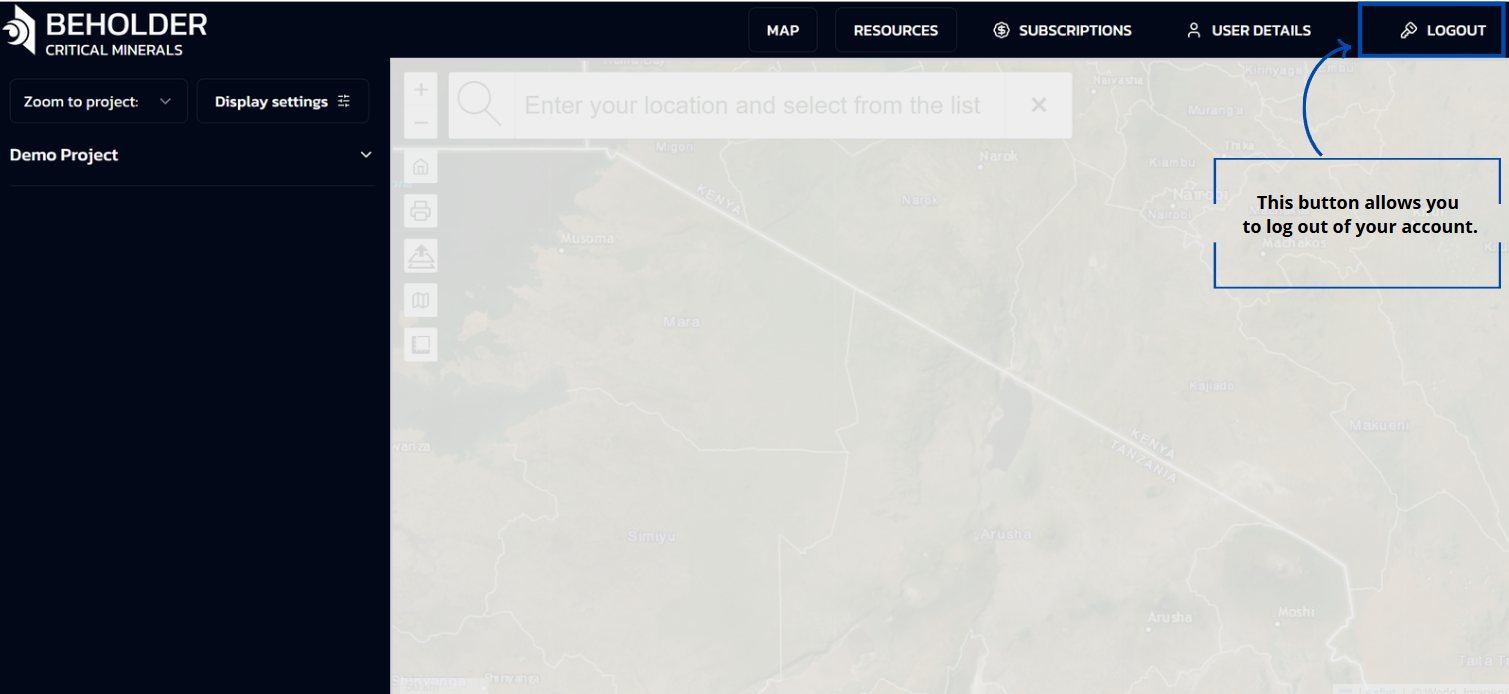
- Manages user authentication
- Provides account switching options
- Allows secure session termination
- Gives access to account settings
!!! warning “Security Note” The platform automatically logs out inactive sessions after a set period. Always use the LOGOUT button when finishing your work.
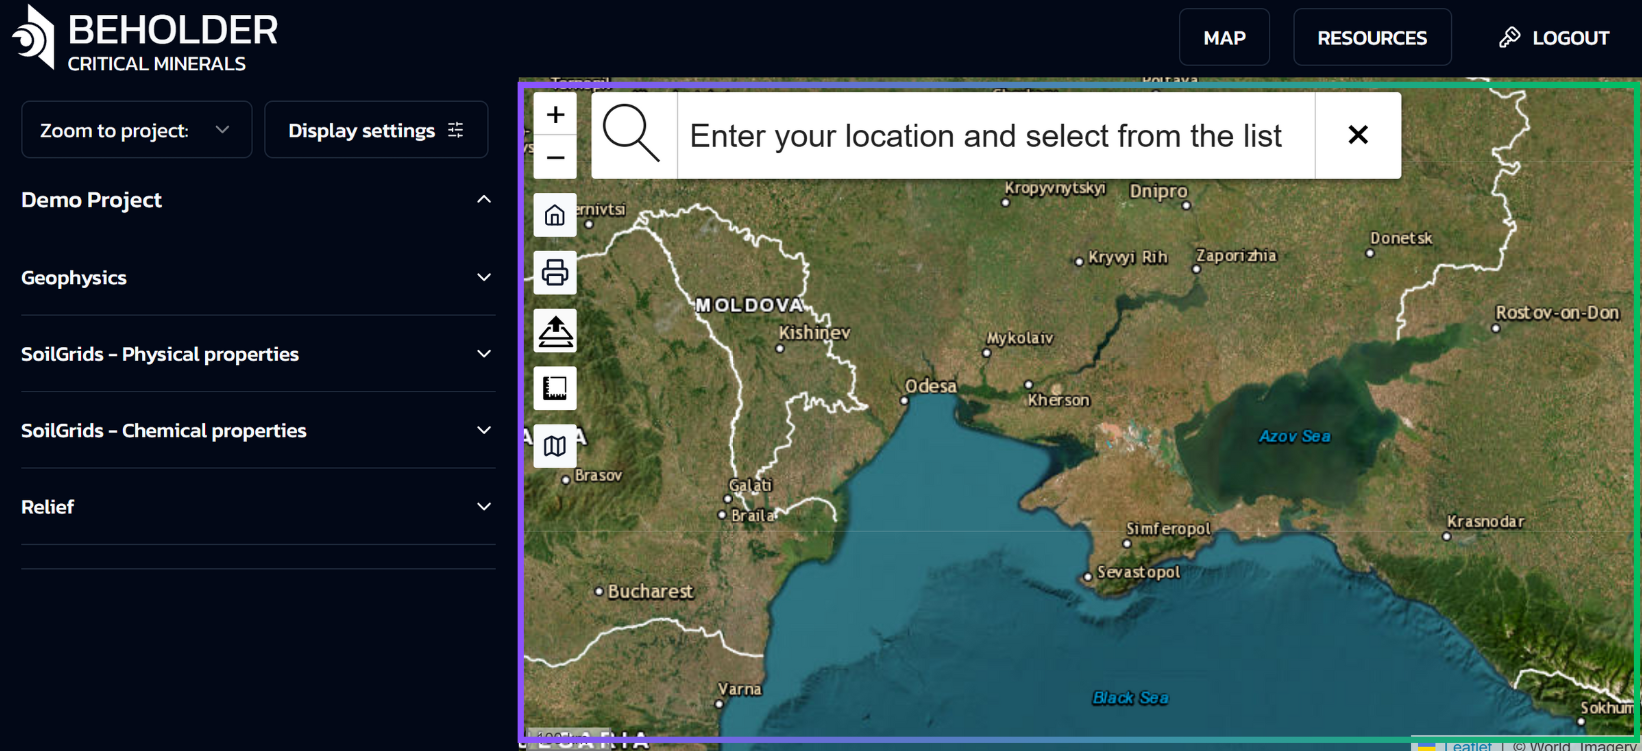
Sidebar
Overview
The interface includes a vertical sidebar on the left side with navigation elements and expandable lists, providing essential controls for project navigation and map display settings.
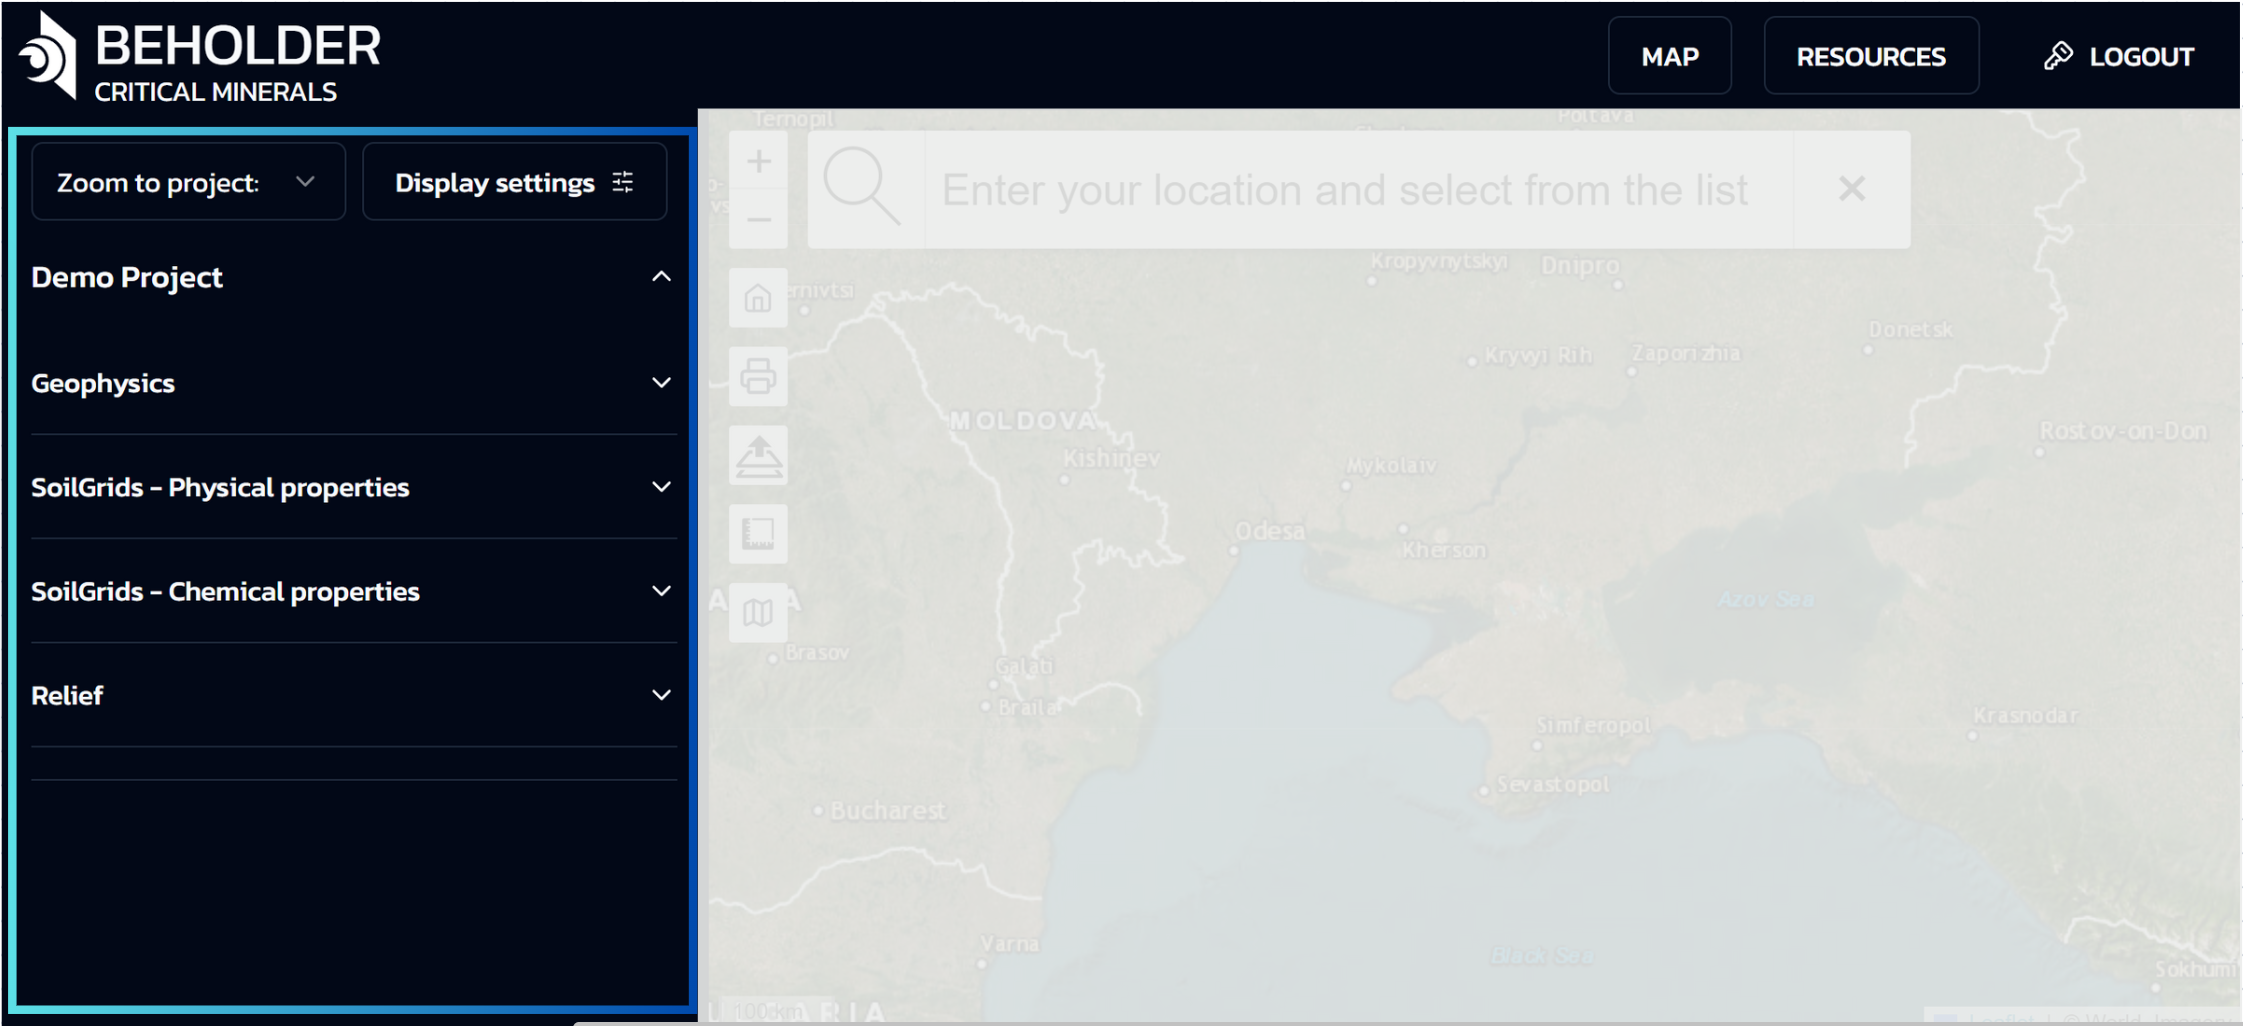
Top Section of the Panel
Zoom to Project
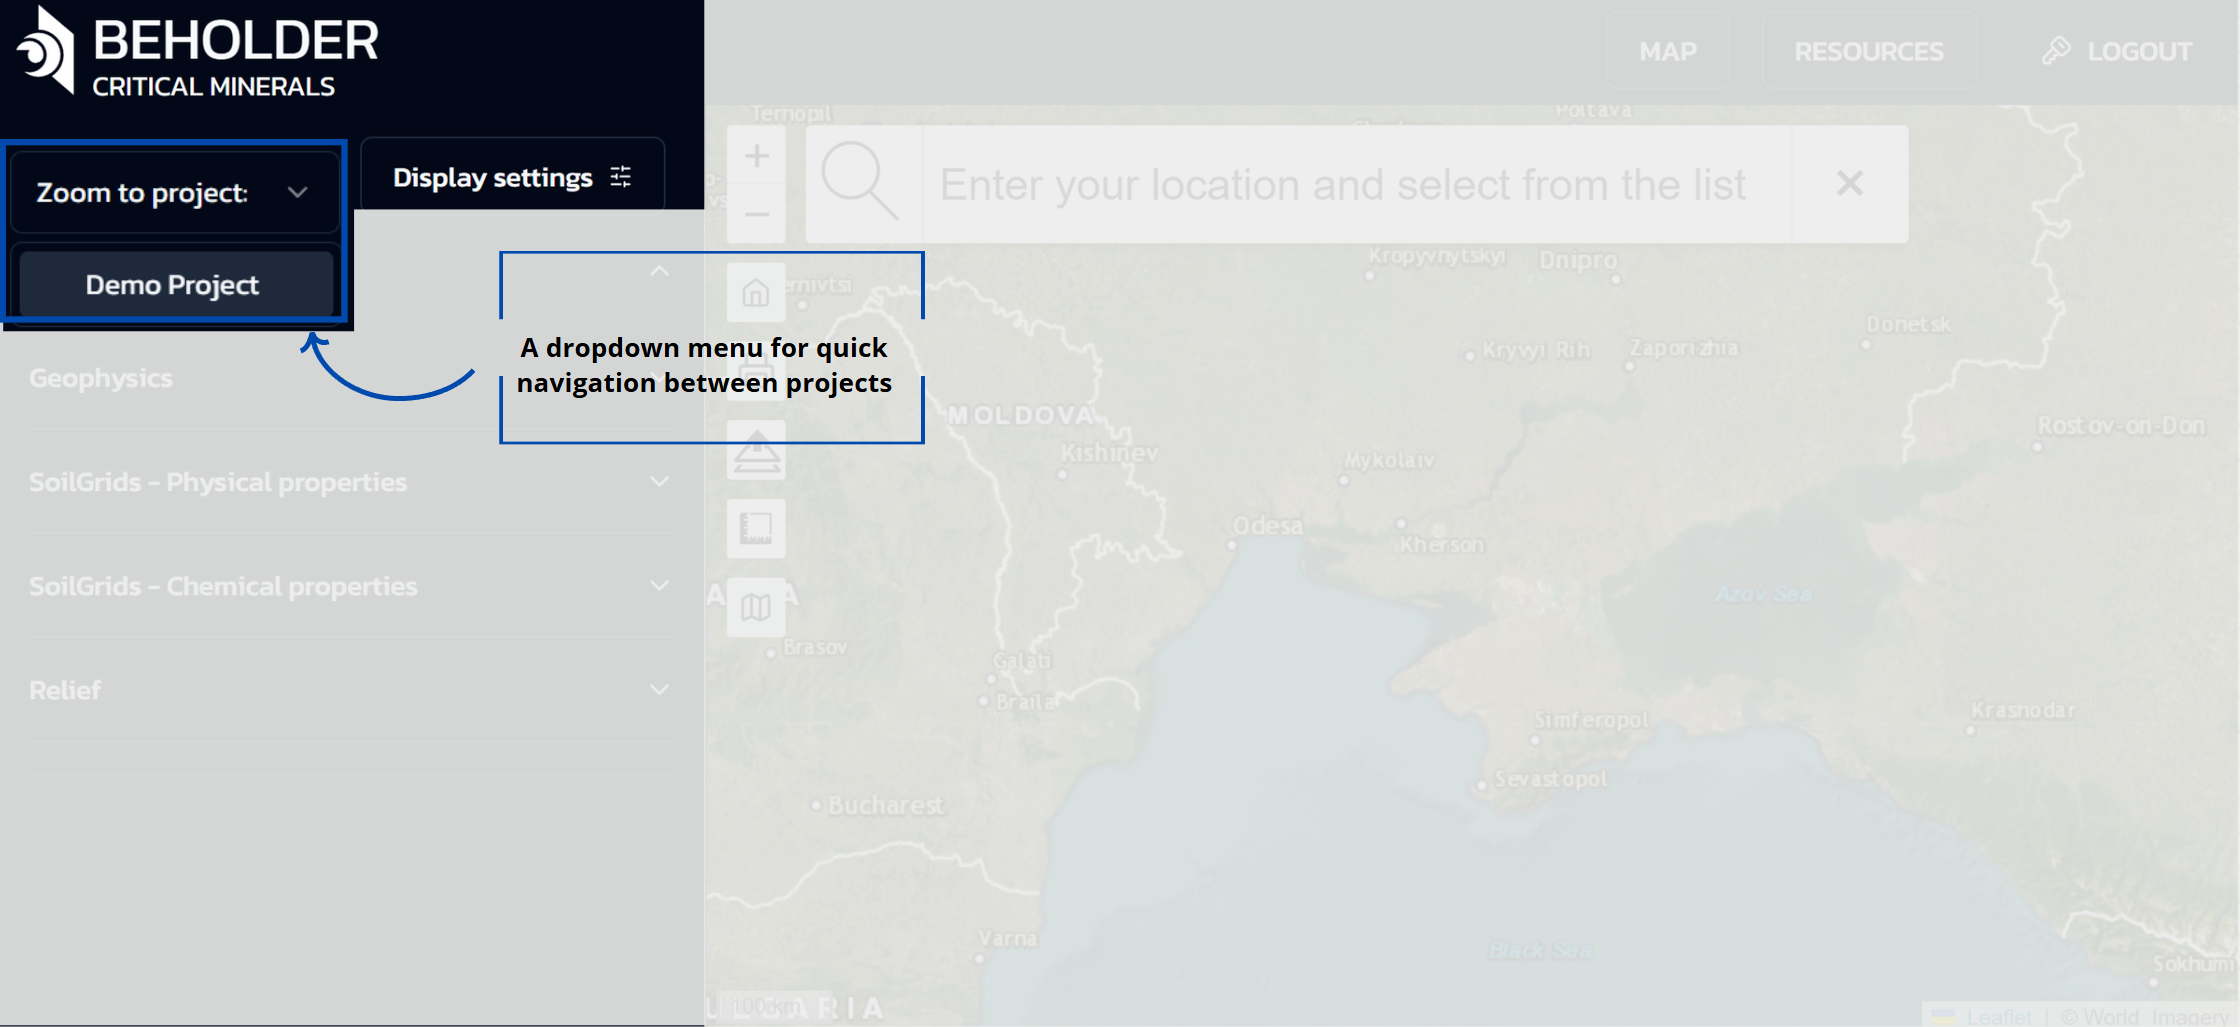
- A dropdown menu for quick navigation between projects
- Currently displays “Demo Project” as the active selection. Depending on your subscription type, lists of projects available to you will be displayed here
Display Settings
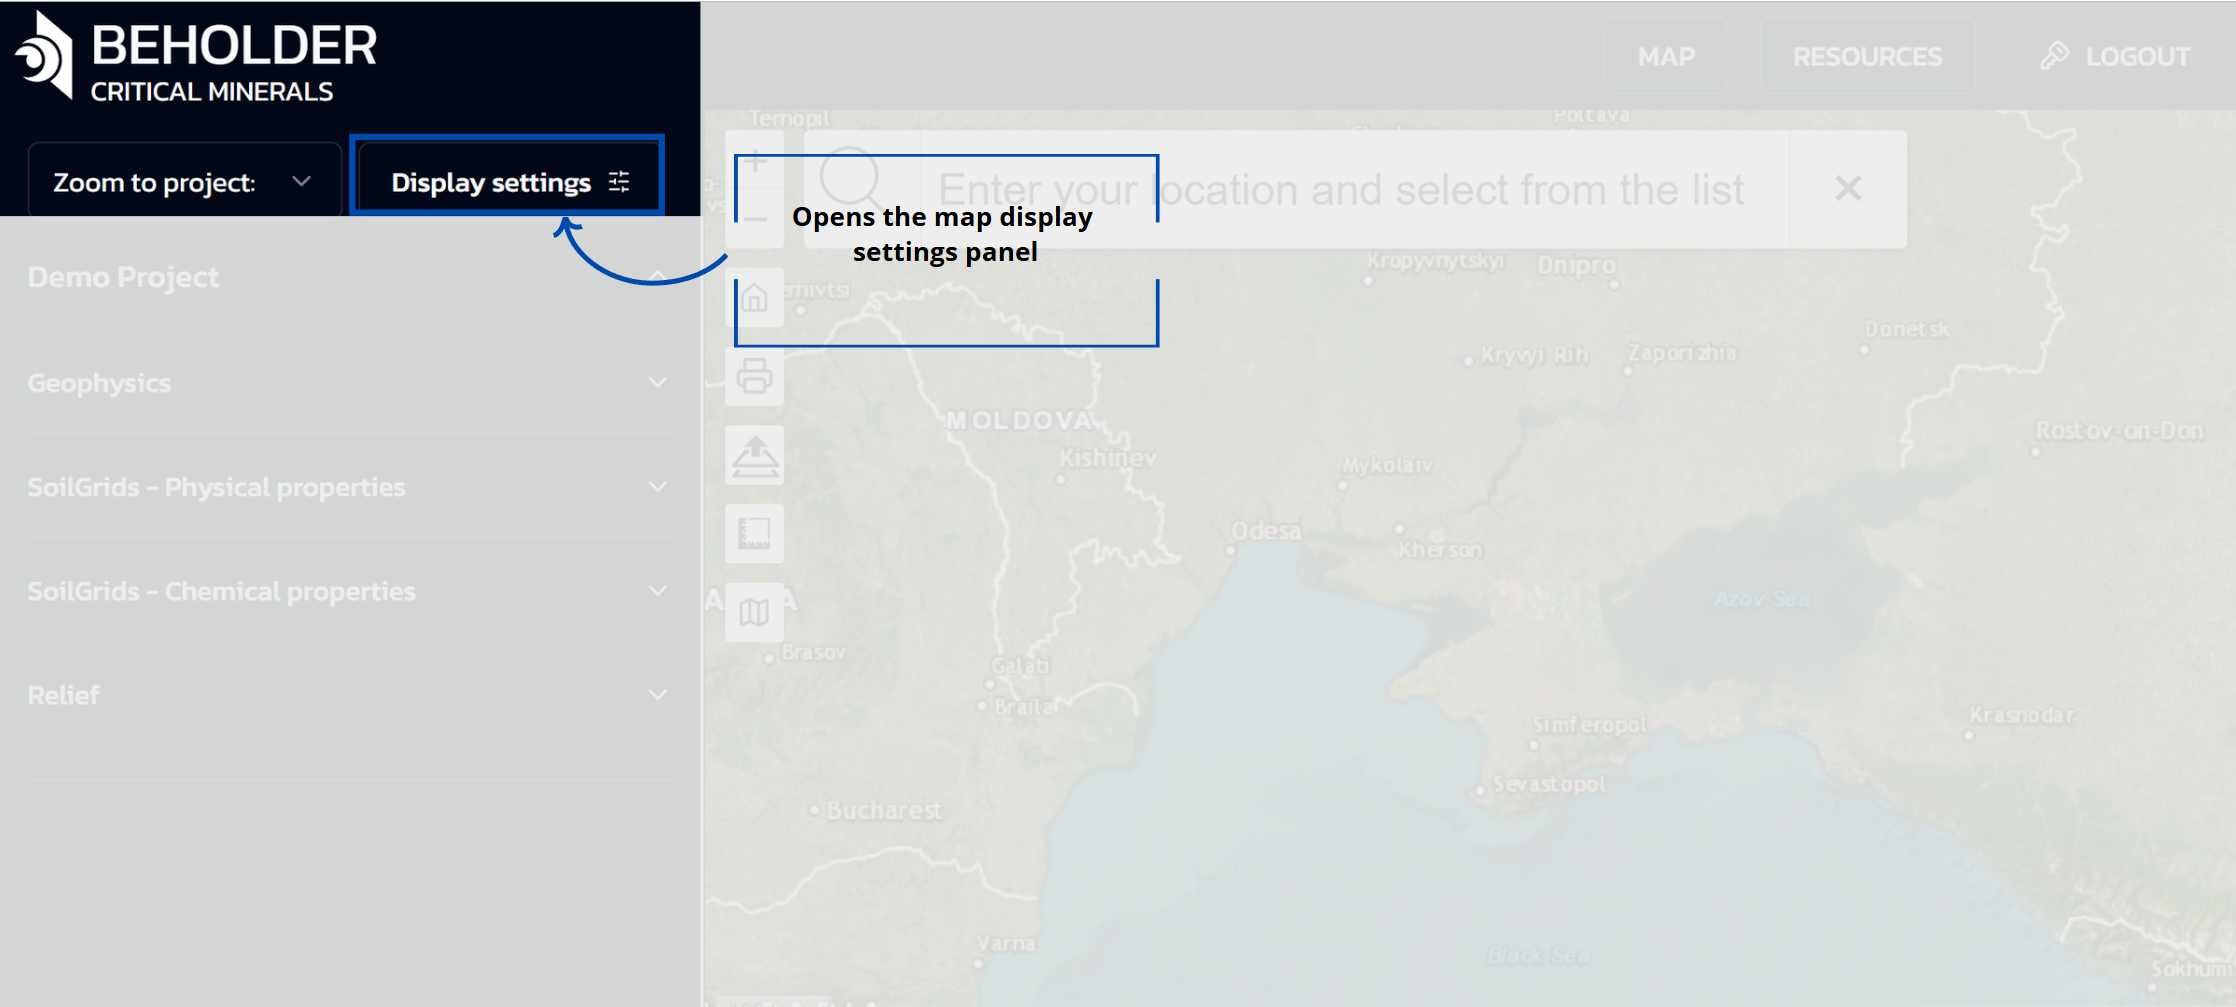
- Opens the map display settings panel with various configuration options
Display Settings Panel
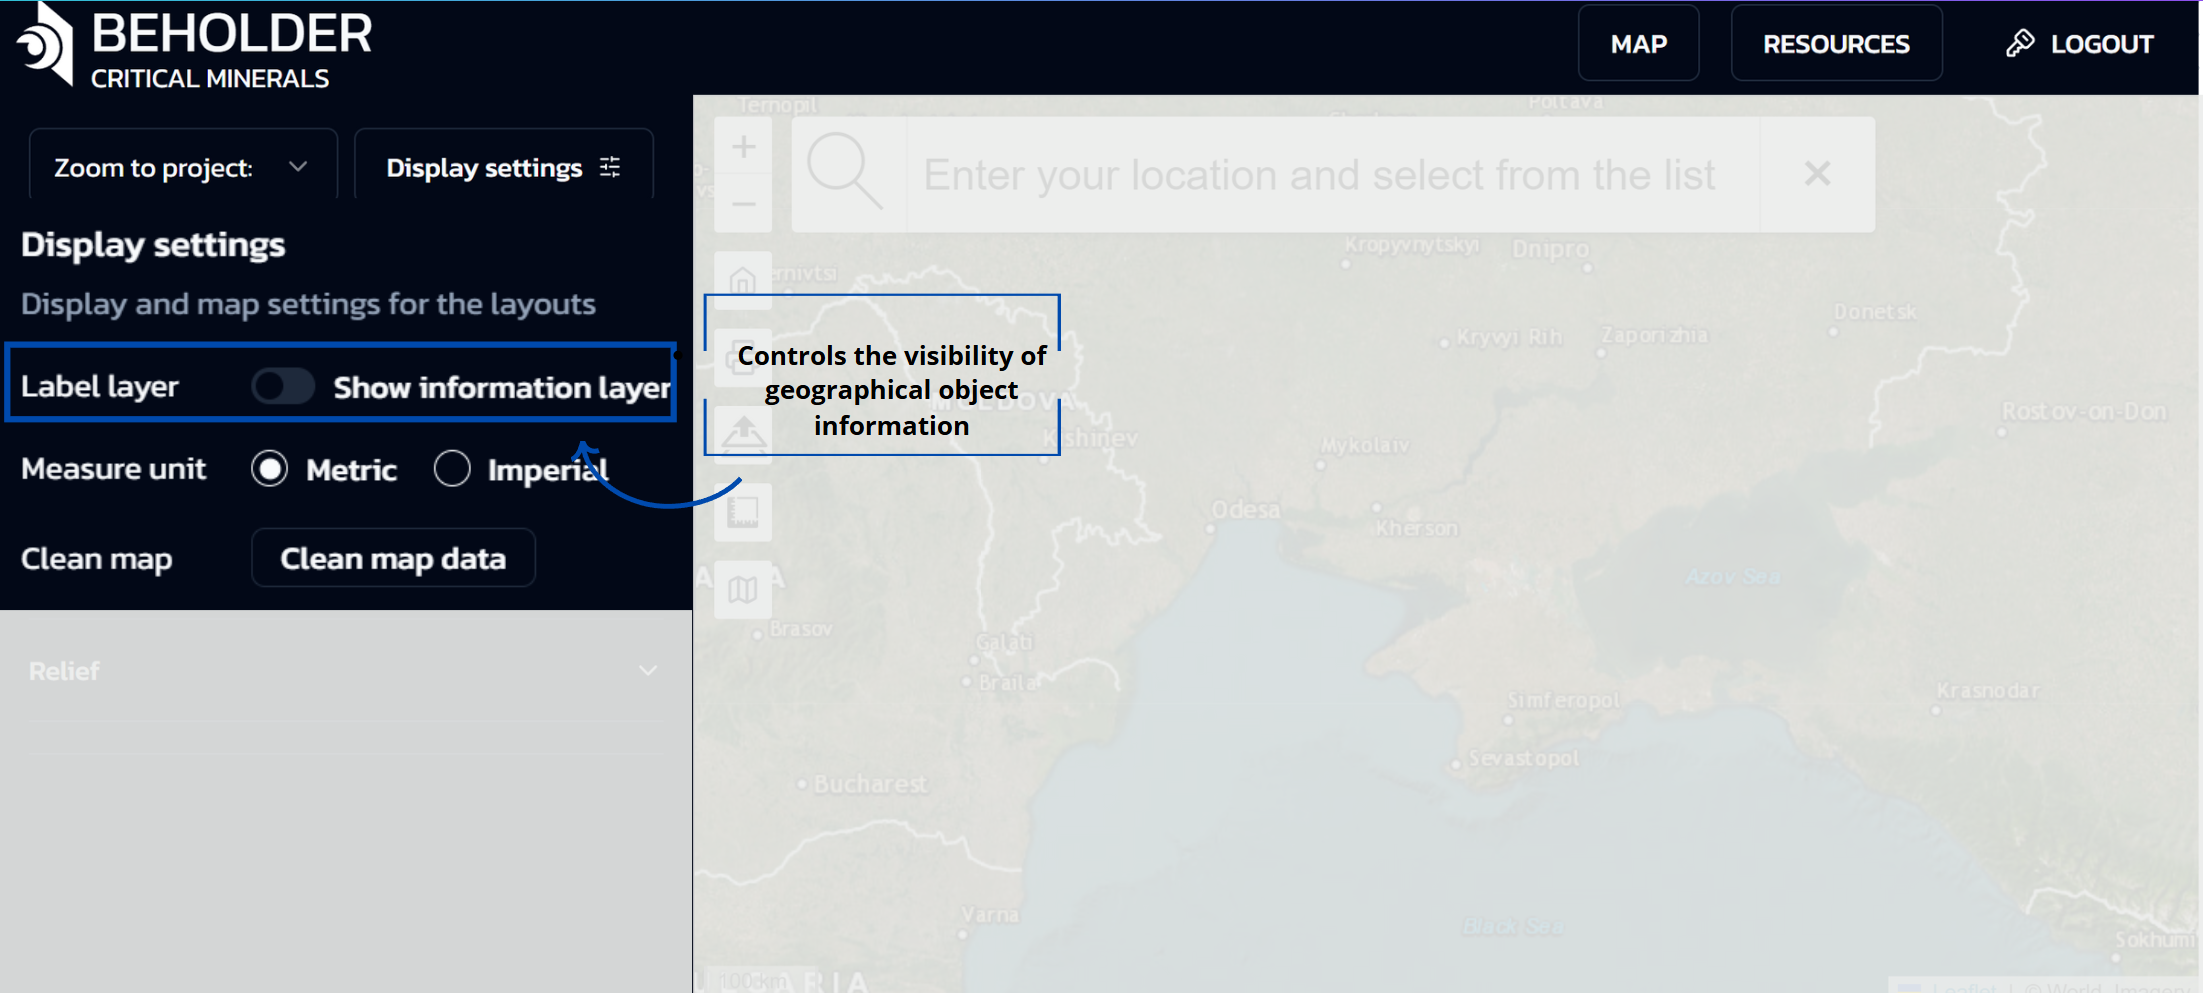 When the “Display settings” button is clicked, a panel opens with the following options:
Label Layer
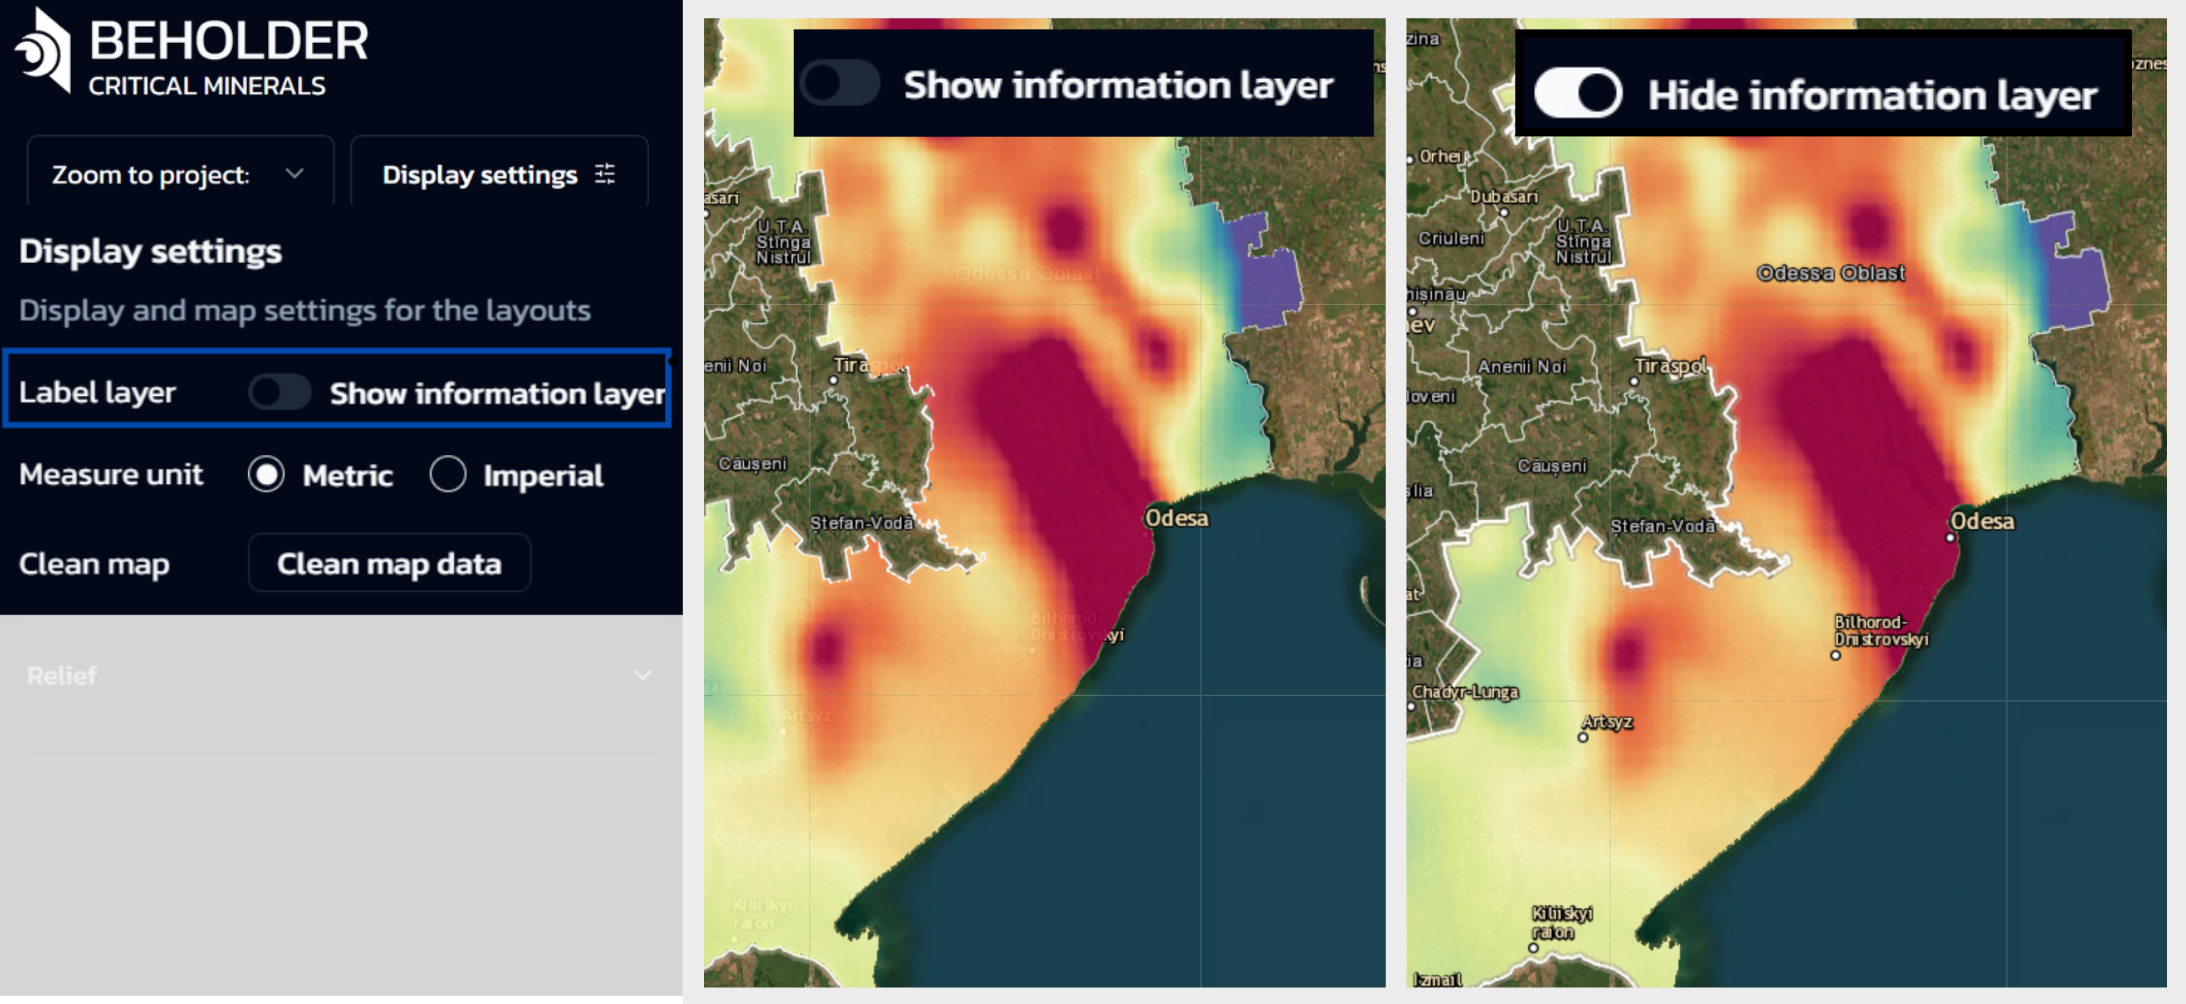
- Controls the visibility of geographical object information
- When OFF: City names and other geographical labels will be hidden under the selected layers
- When ON: City and settlement names will be displayed on the map over selected territories
Measure Unit
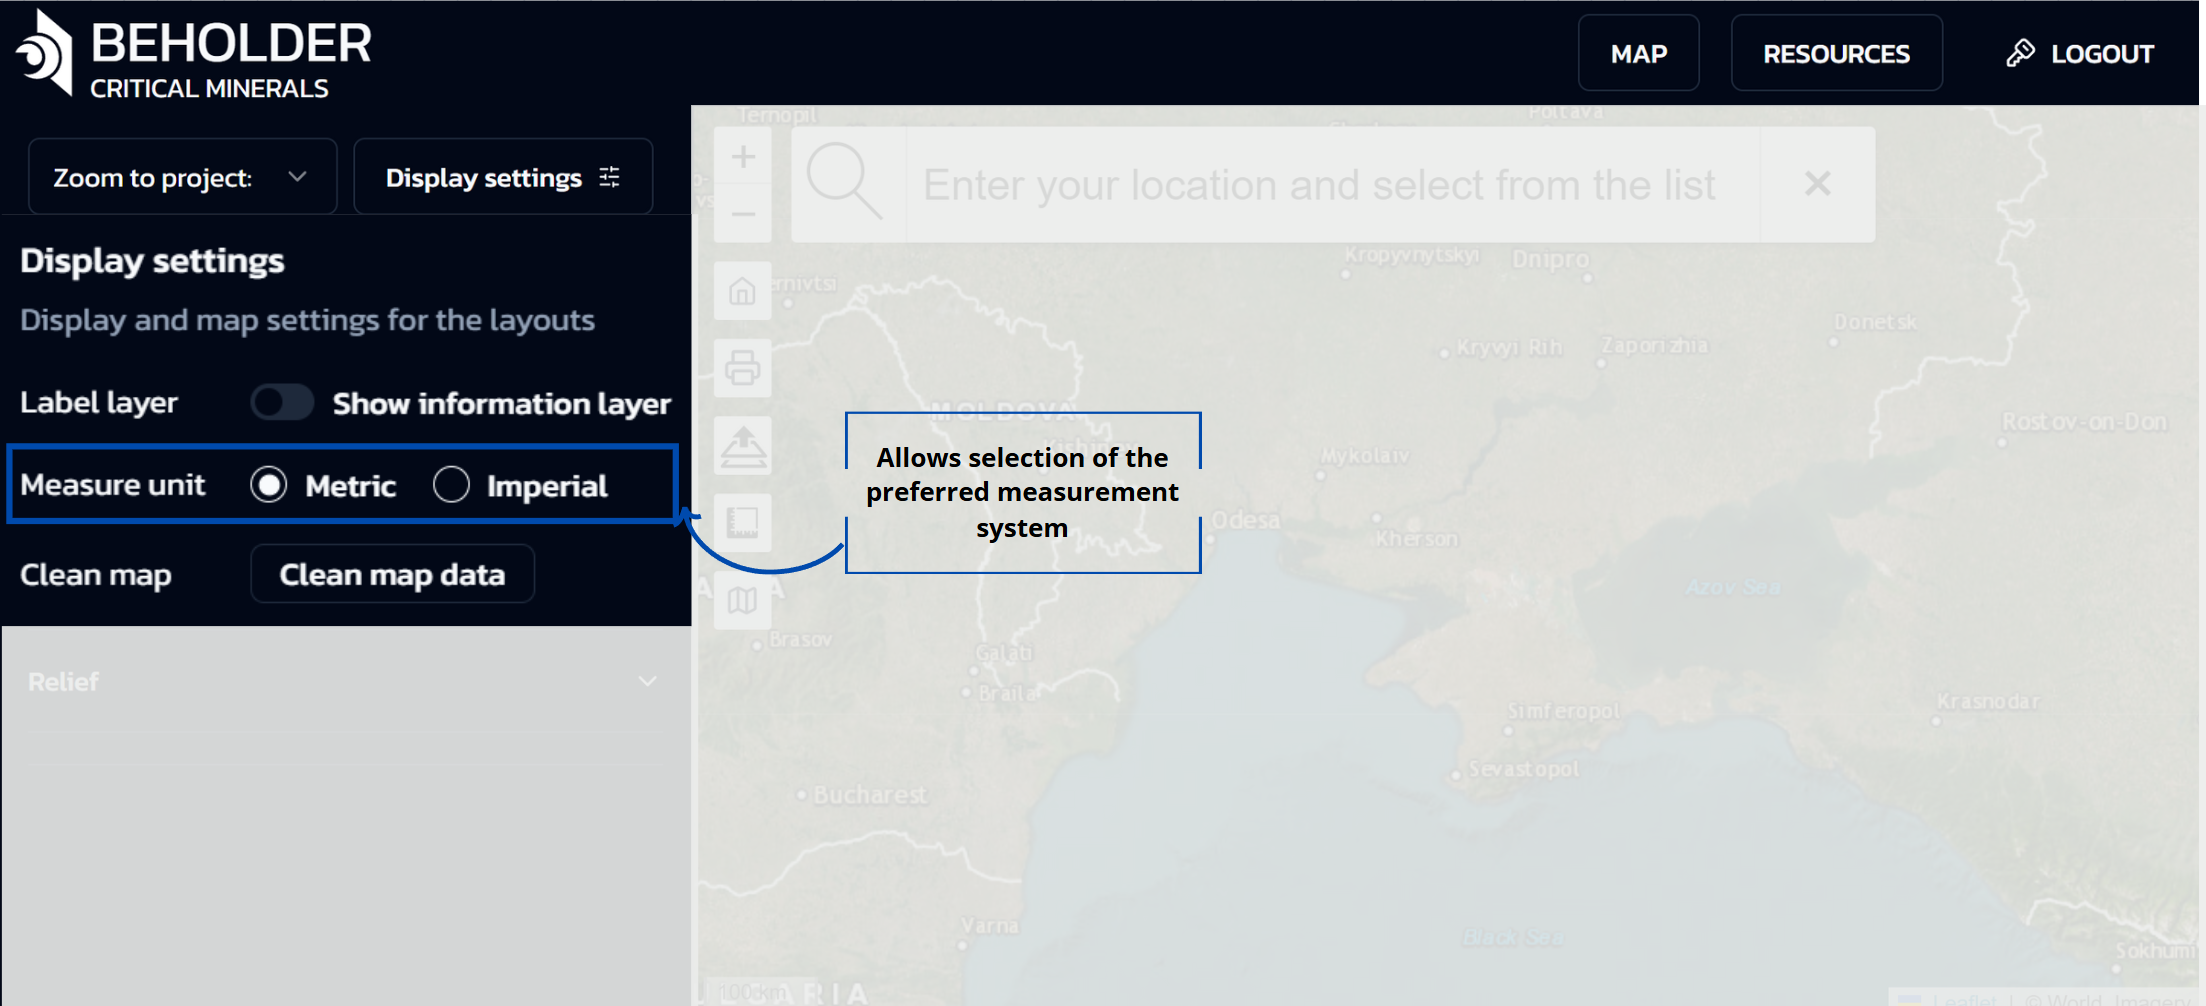
- Allows selection of the preferred measurement system:
- Metric: Kilometers, meters, etc.
- Imperial: Miles, feet, etc.
Clean Map Data
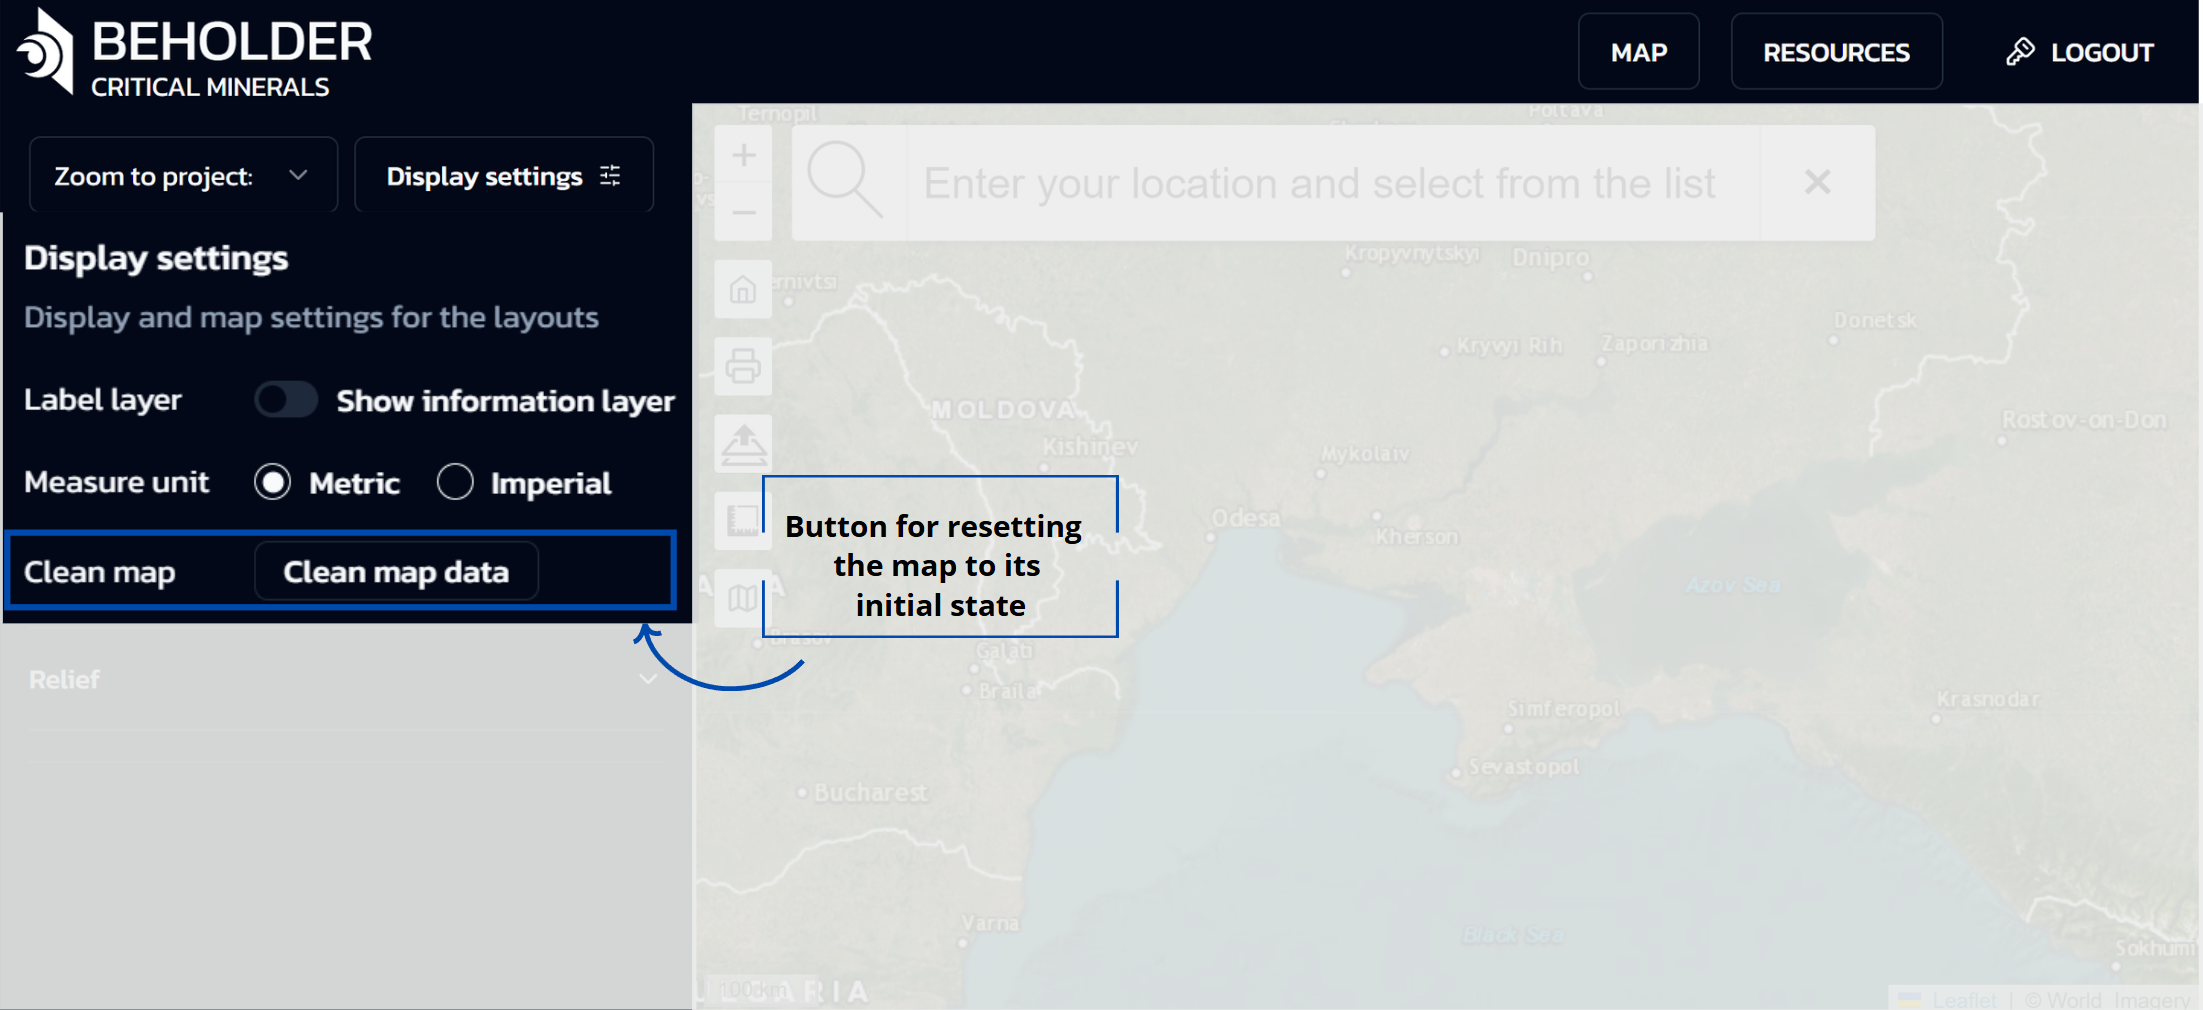
- Button for resetting the map to its initial state
- Clears all user selections, filters, and displayed data layers
- Returns the map interface to its default configuration
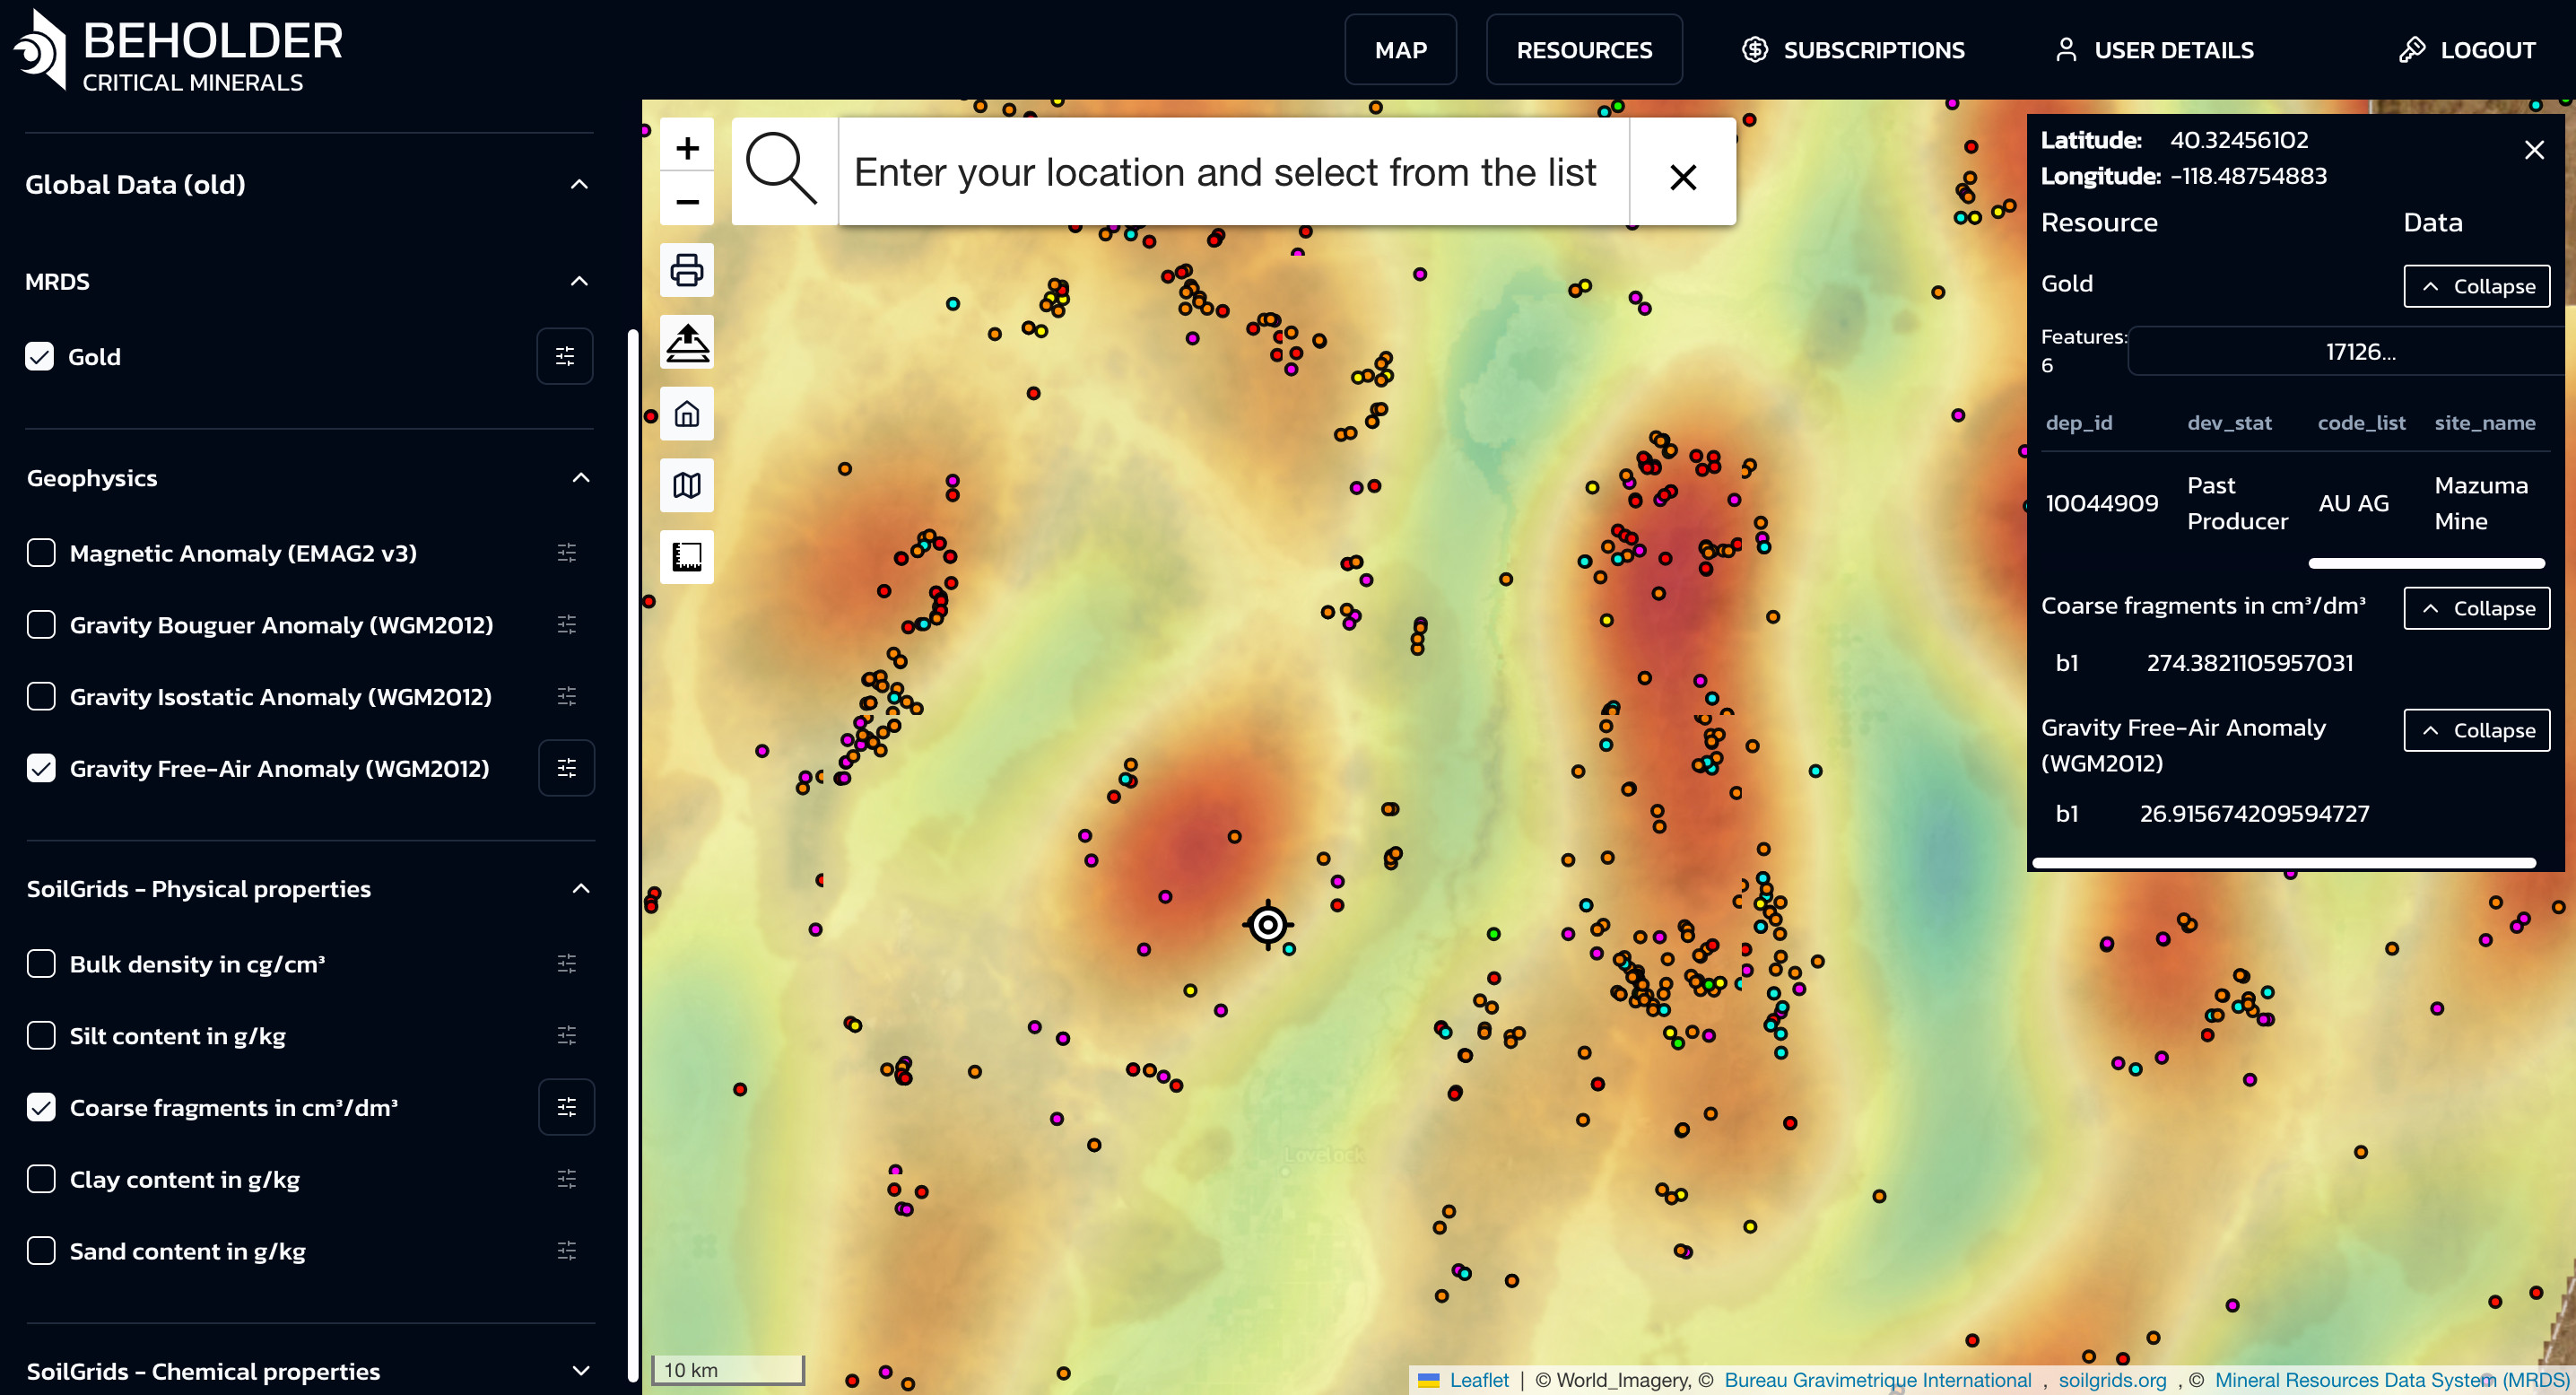
Data Categories Panel
The left side of the interface represents a data categories panel organized as a hierarchical menu with dropdown lists. This panel provides access to various types of geodata with the ability to select and combine them. The main sections of the panel include:
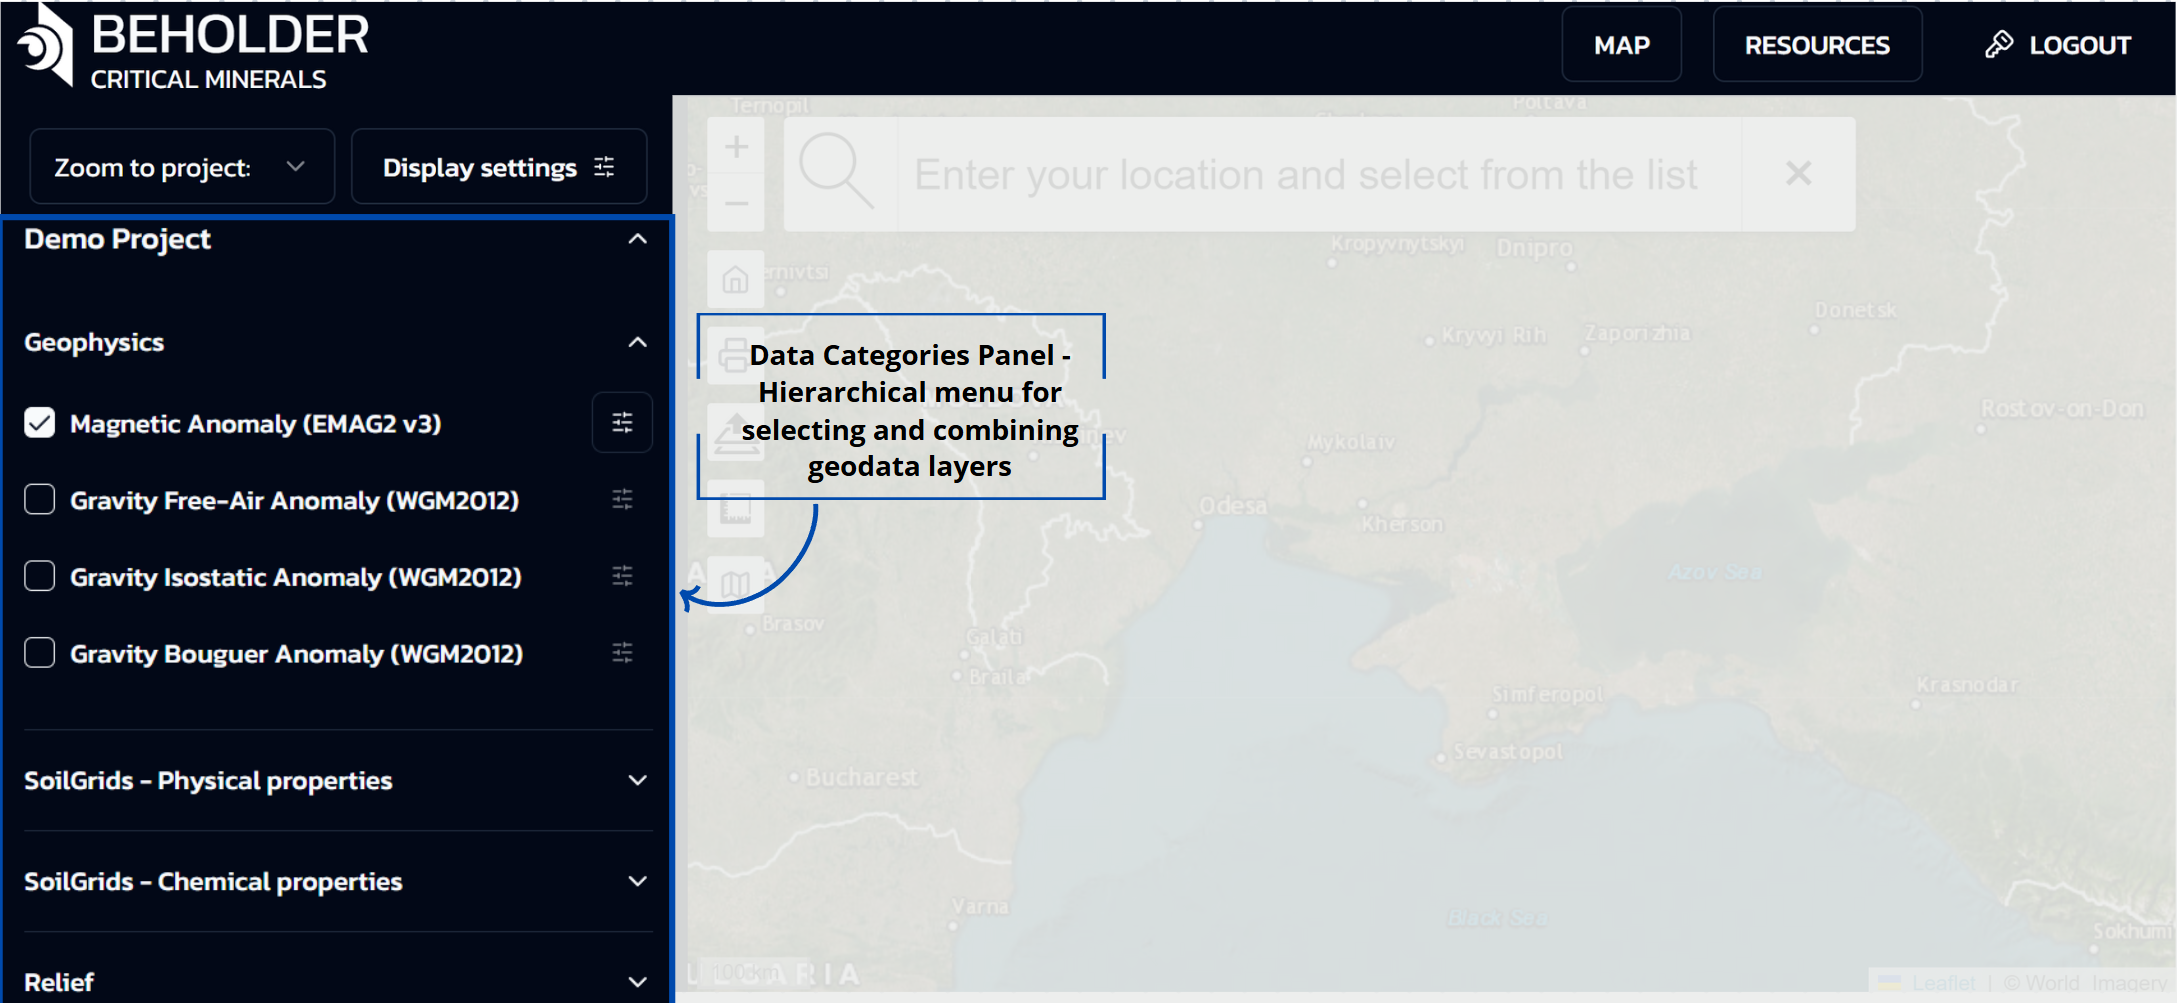
- Geophysics - Geophysical data (magnetic and gravitational anomalies)
- SoilGrids - Physical properties - Physical soil characteristics
- SoilGrids - Chemical properties - Chemical soil characteristics
- Relief - Terrain elevation data
Main capabilities of the categories panel:
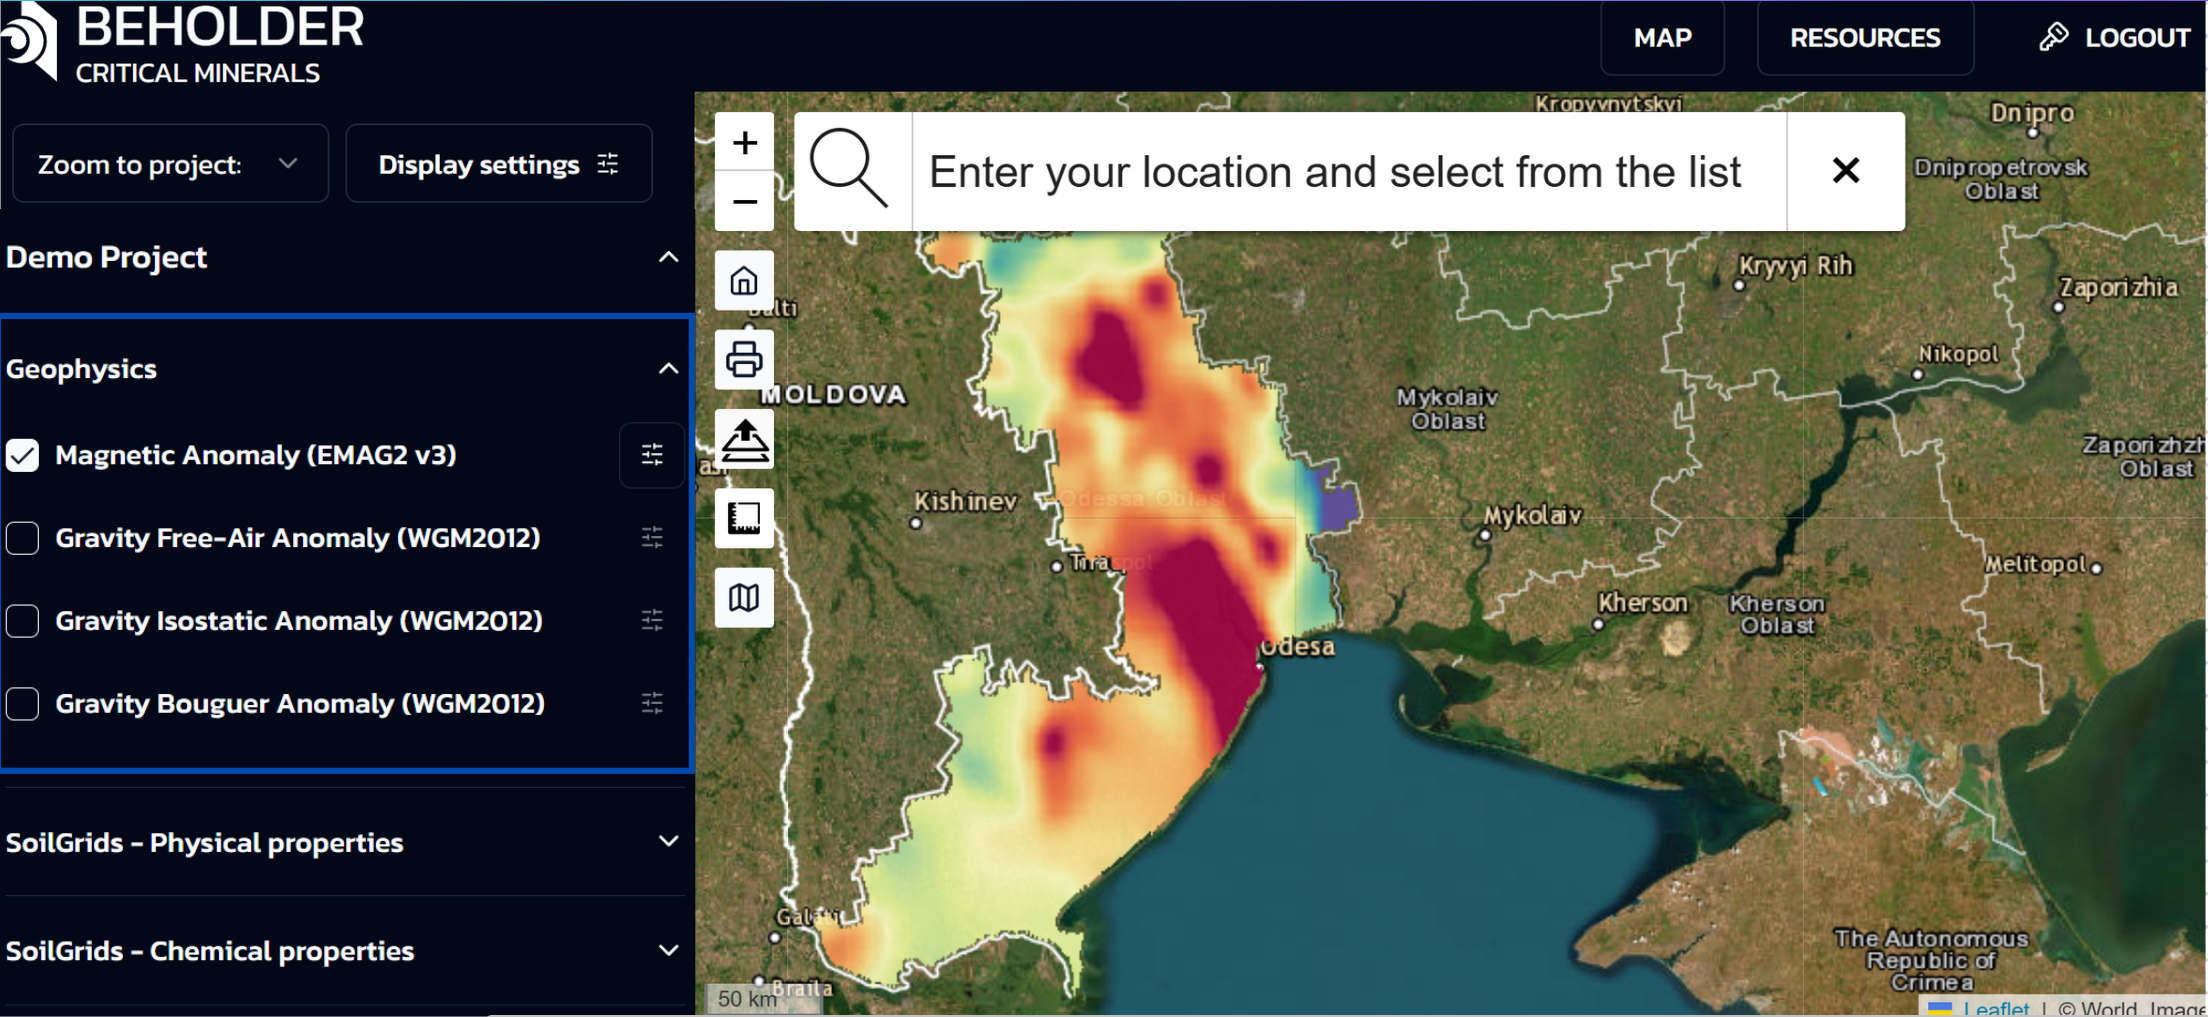
- Layer Management: Users can enable and disable individual data layers using checkboxes. Layer activation instantly displays the corresponding geodata on the map.
- Multi-layer Display: The system allows activation of multiple layers simultaneously. Each subsequently activated layer will be displayed on top of previous ones, creating a multi-layered data composition.
- Individual Settings: For each active layer, a separate “Layer settings” panel automatically opens, allowing independent configuration of display parameters.
Layer Settings Panel
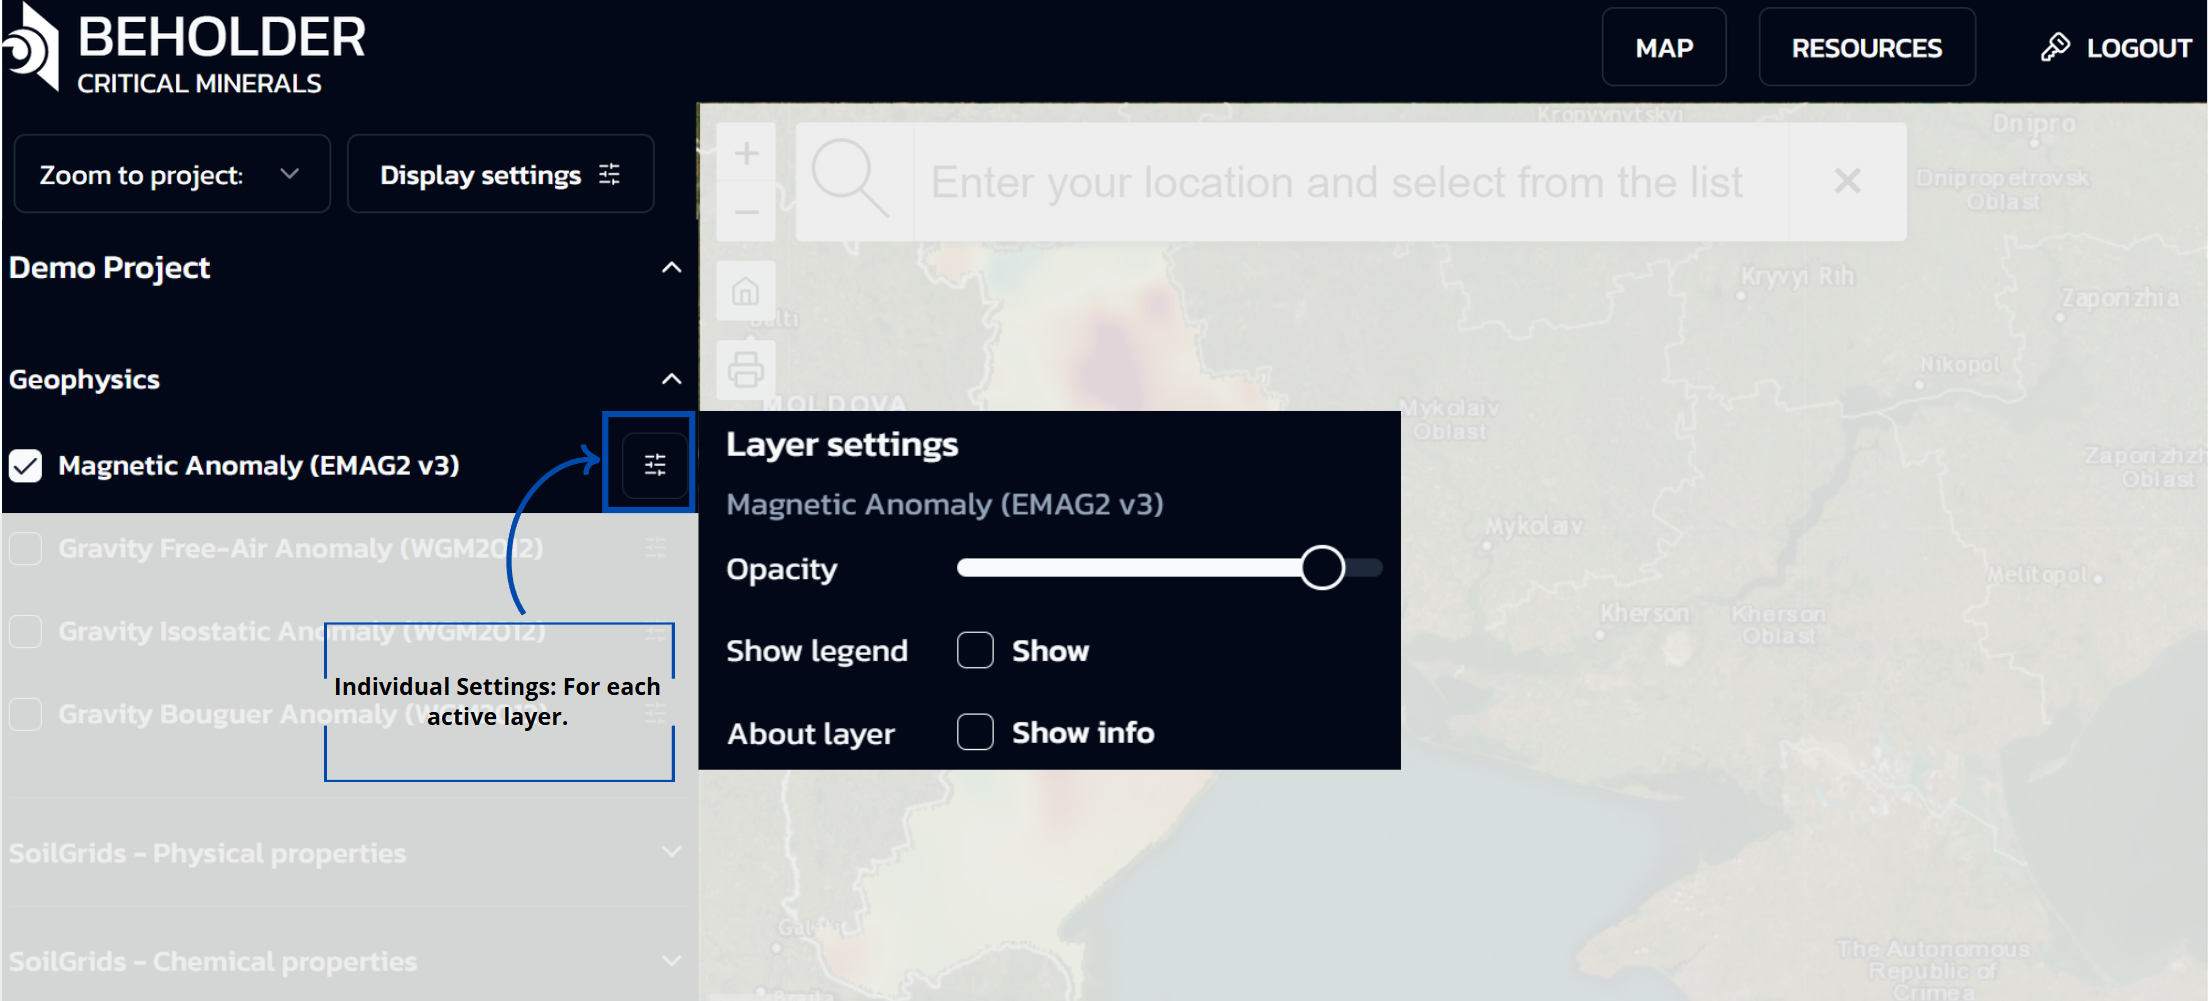
When a user activates any layer via checkbox in the categories panel, an additional “Layer settings” panel automatically appears, providing advanced configuration options for the specific data layer. This panel includes:
-
Layer title: Displays the name of the active layer
-
Opacity regulator: Slider for adjusting layer transparency
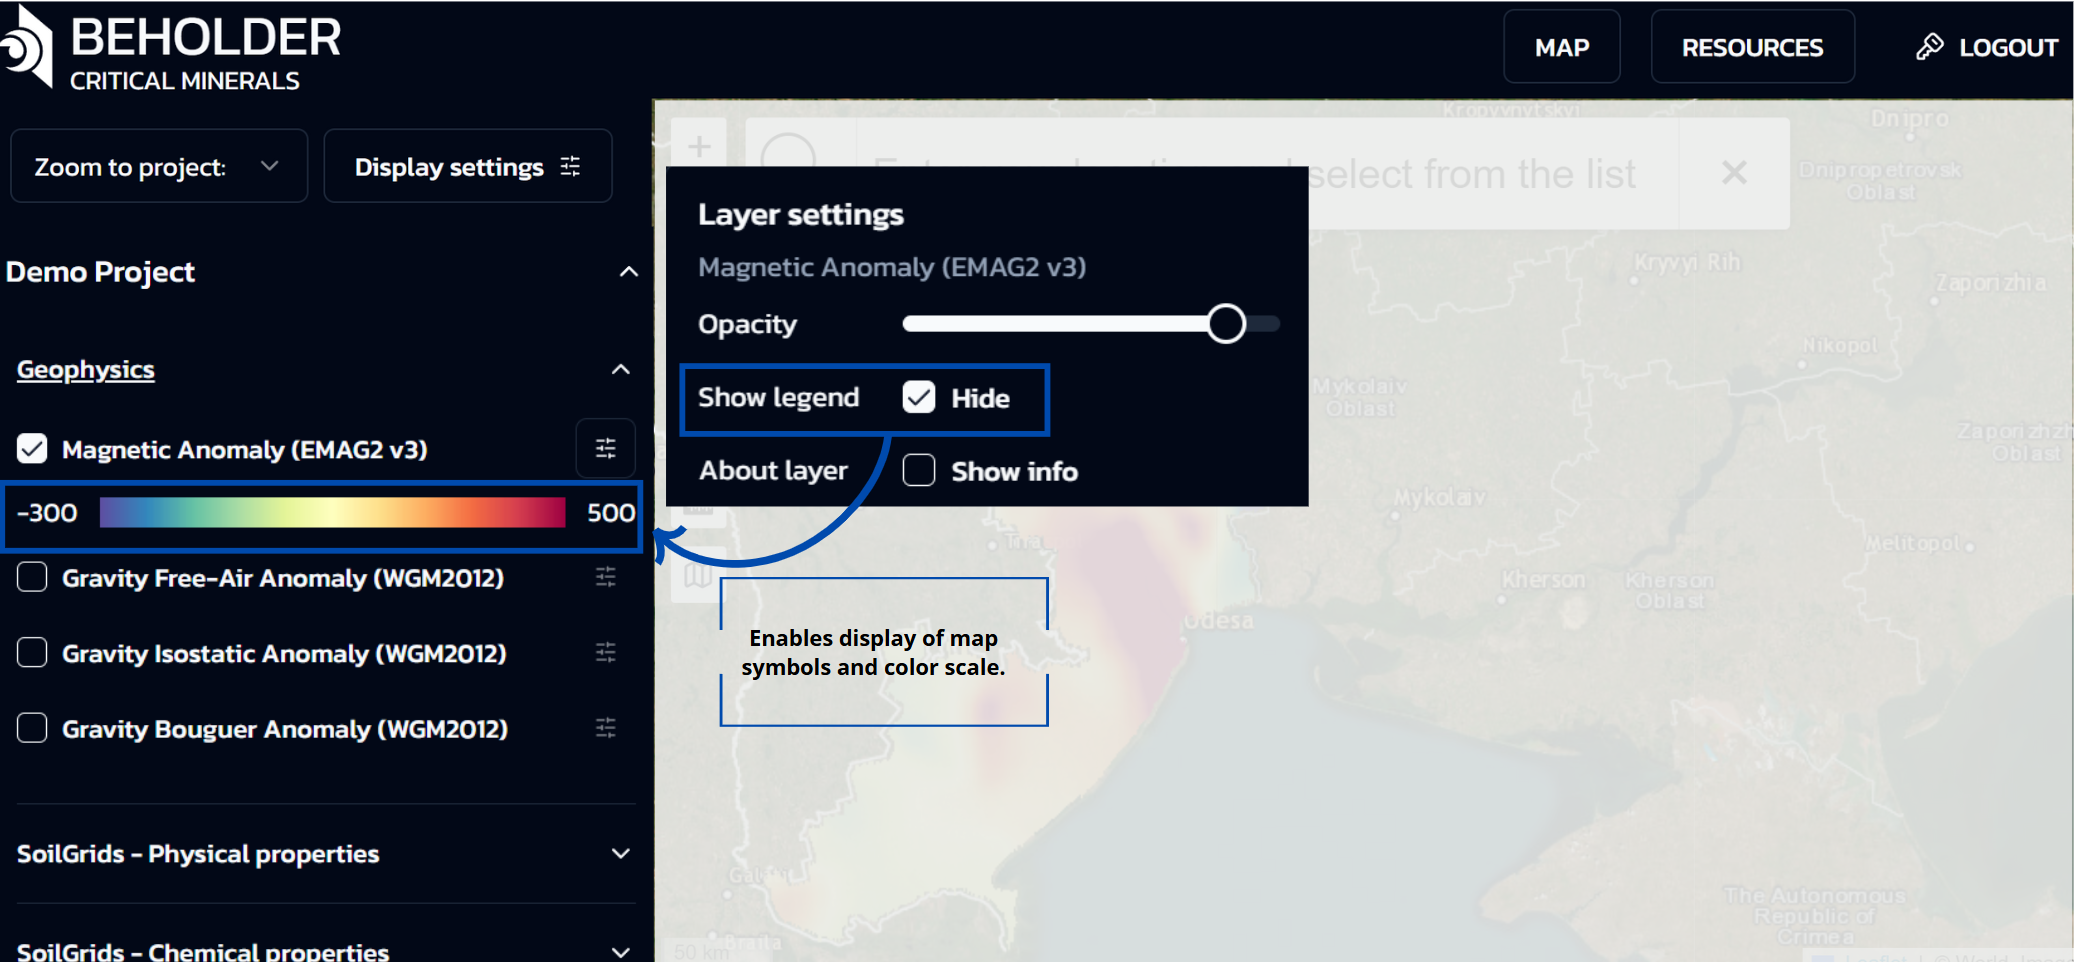
-
Show legend option: Enables display of map symbols and color scale
- Show info When activated, this option displays additional information in a popup window containing details such as Metadata, Abstract, Distributor, and Data Source
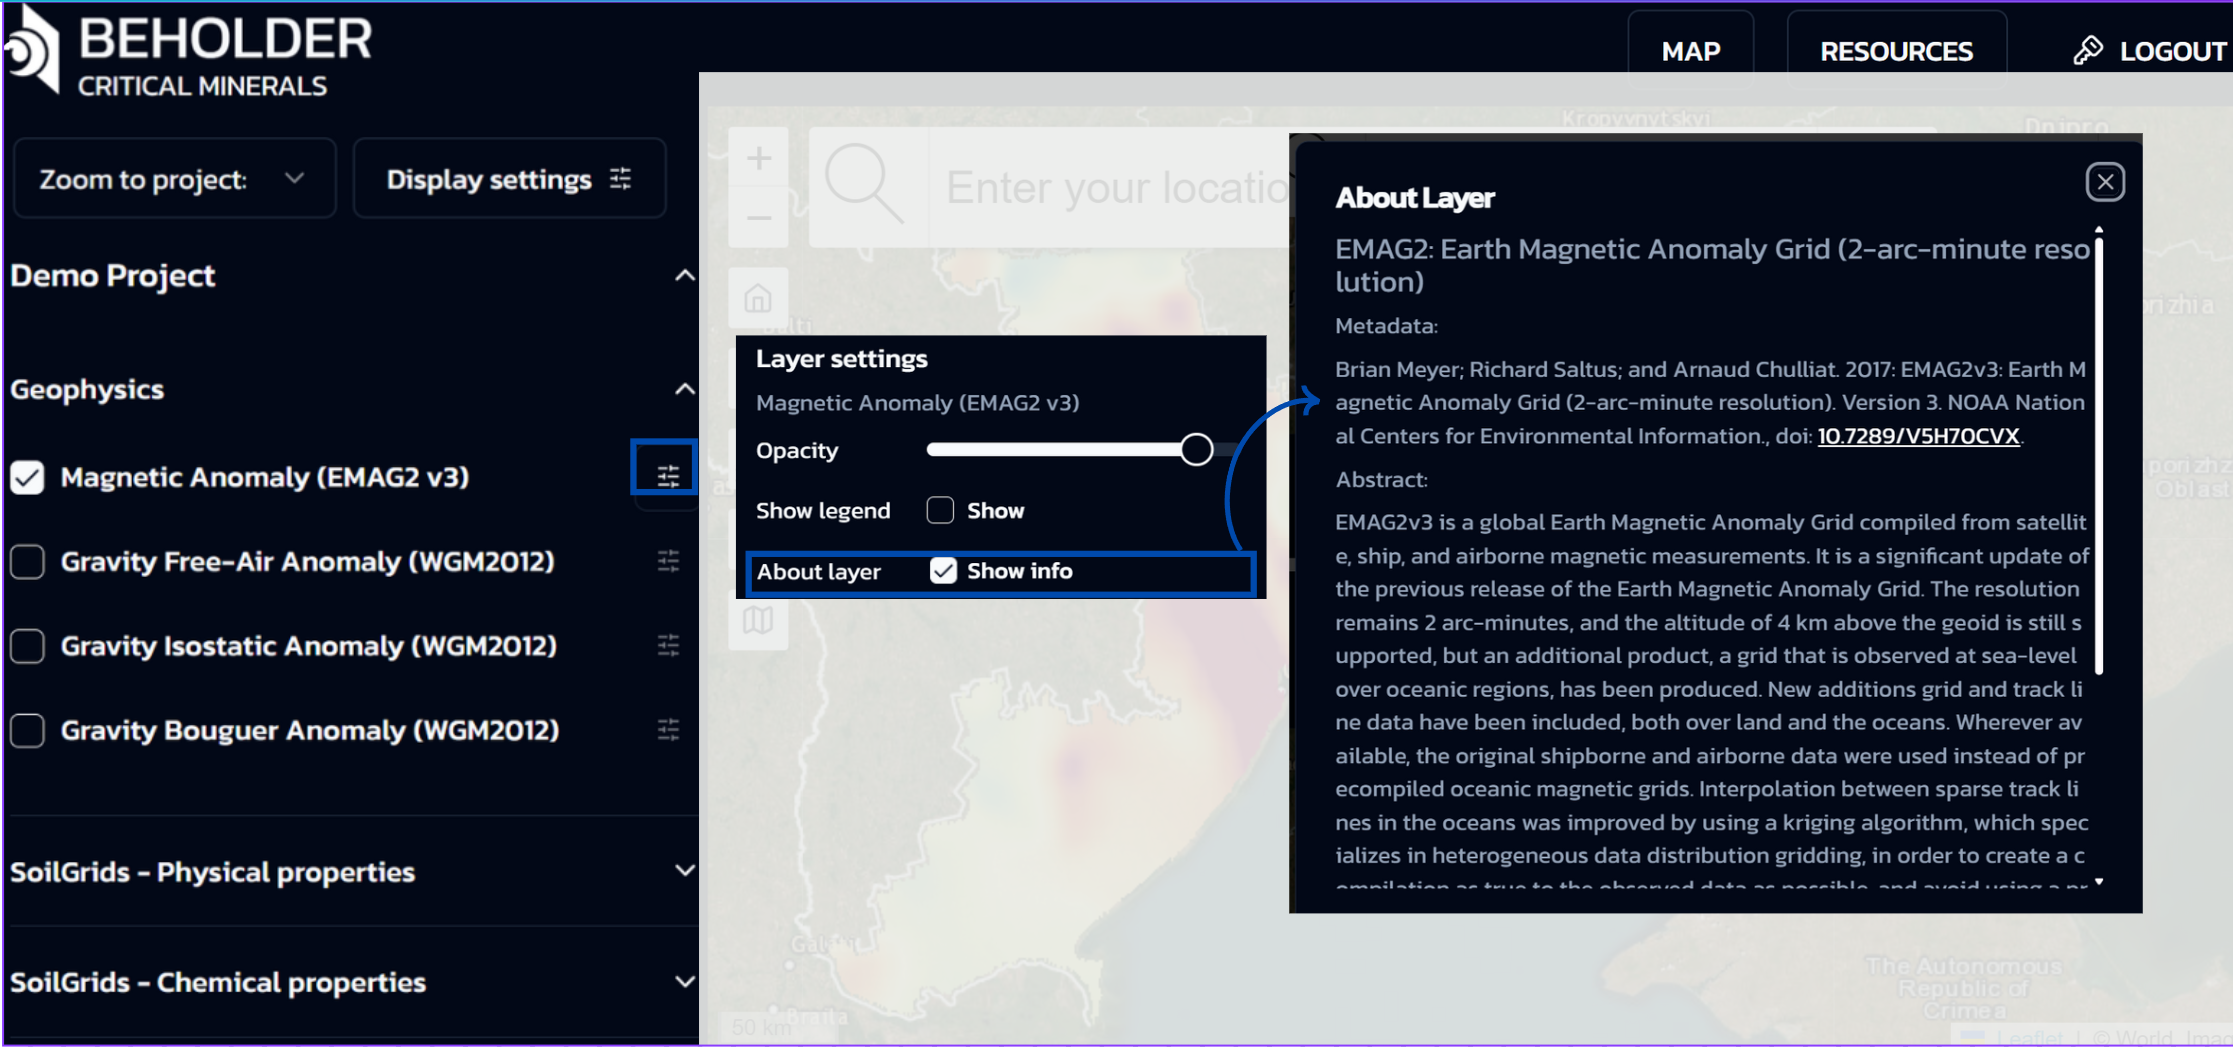
The layer settings panel appears independently for each activated layer, allowing individual display parameter configuration for all active layers simultaneously.
Functional significance and application
This two-panel interface structure provides a convenient and flexible approach to working with geodata:
- First, users select the types of data they’re interested in from the categories panel
- Then they configure display parameters for each layer through the layer settings panel
- When needed, users can create complex combinations of different data types for comprehensive territory analysis
!!! info “Documentation” Complete descriptions of all available data, collection methods, and interpretation guidelines can be found at: geology.data.documentation.
Main Map Area
Sidebar Toolbar
The navigation sidebar is located on the left side of the interface and contains the following controls (from top to bottom). The sidebar provides quick access to the main navigation and map operation functions without cluttering the main cartographic interface.
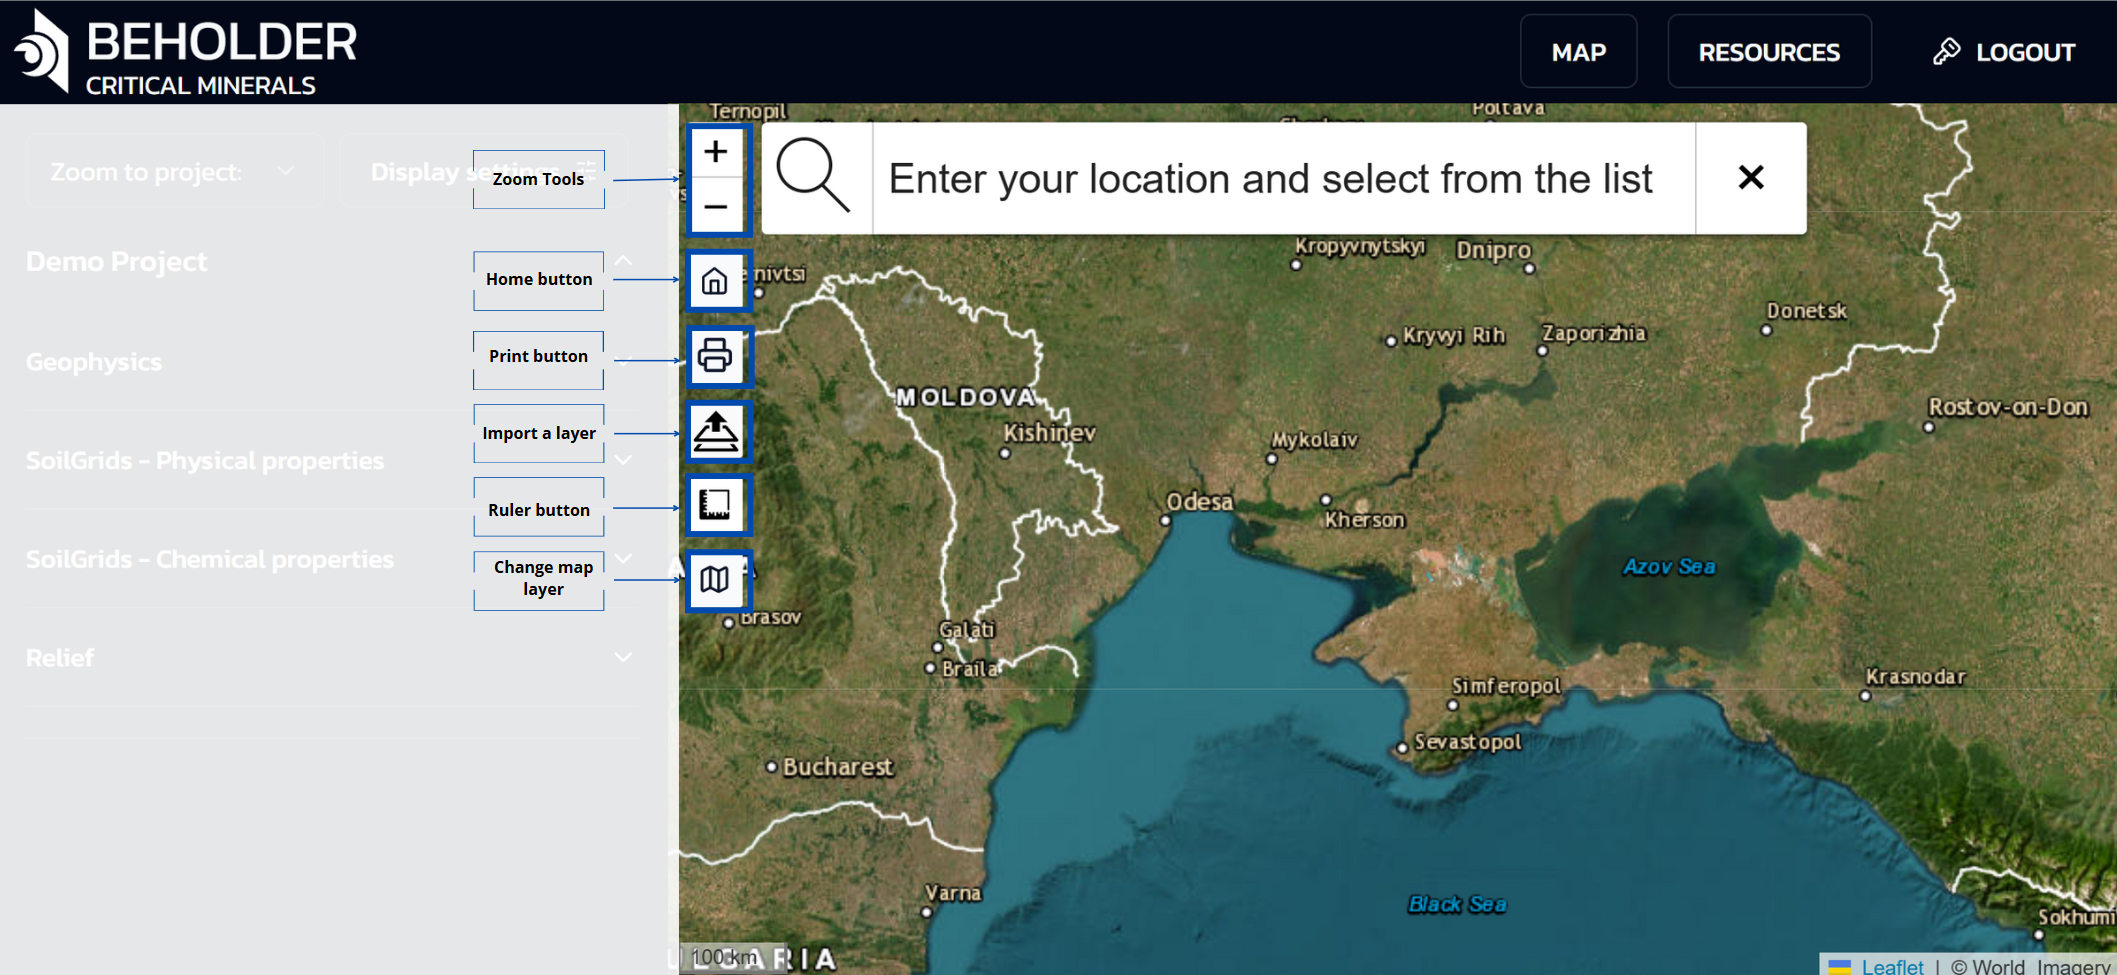
Zoom Tools
- Zoom in button (+)
- Zoom out button (−)
Main Control Buttons
- Home button – Returns to the initial map view
- Print button – Outputs the current map view for printing
- Import a layer button – Adds custom layers to the map
- Ruler button – Distance measurement tool
- Change Map Layer – basemap selection
Layer Management
Basemap Selection
The application provides the ability to switch between different types of basemaps for optimal information display:
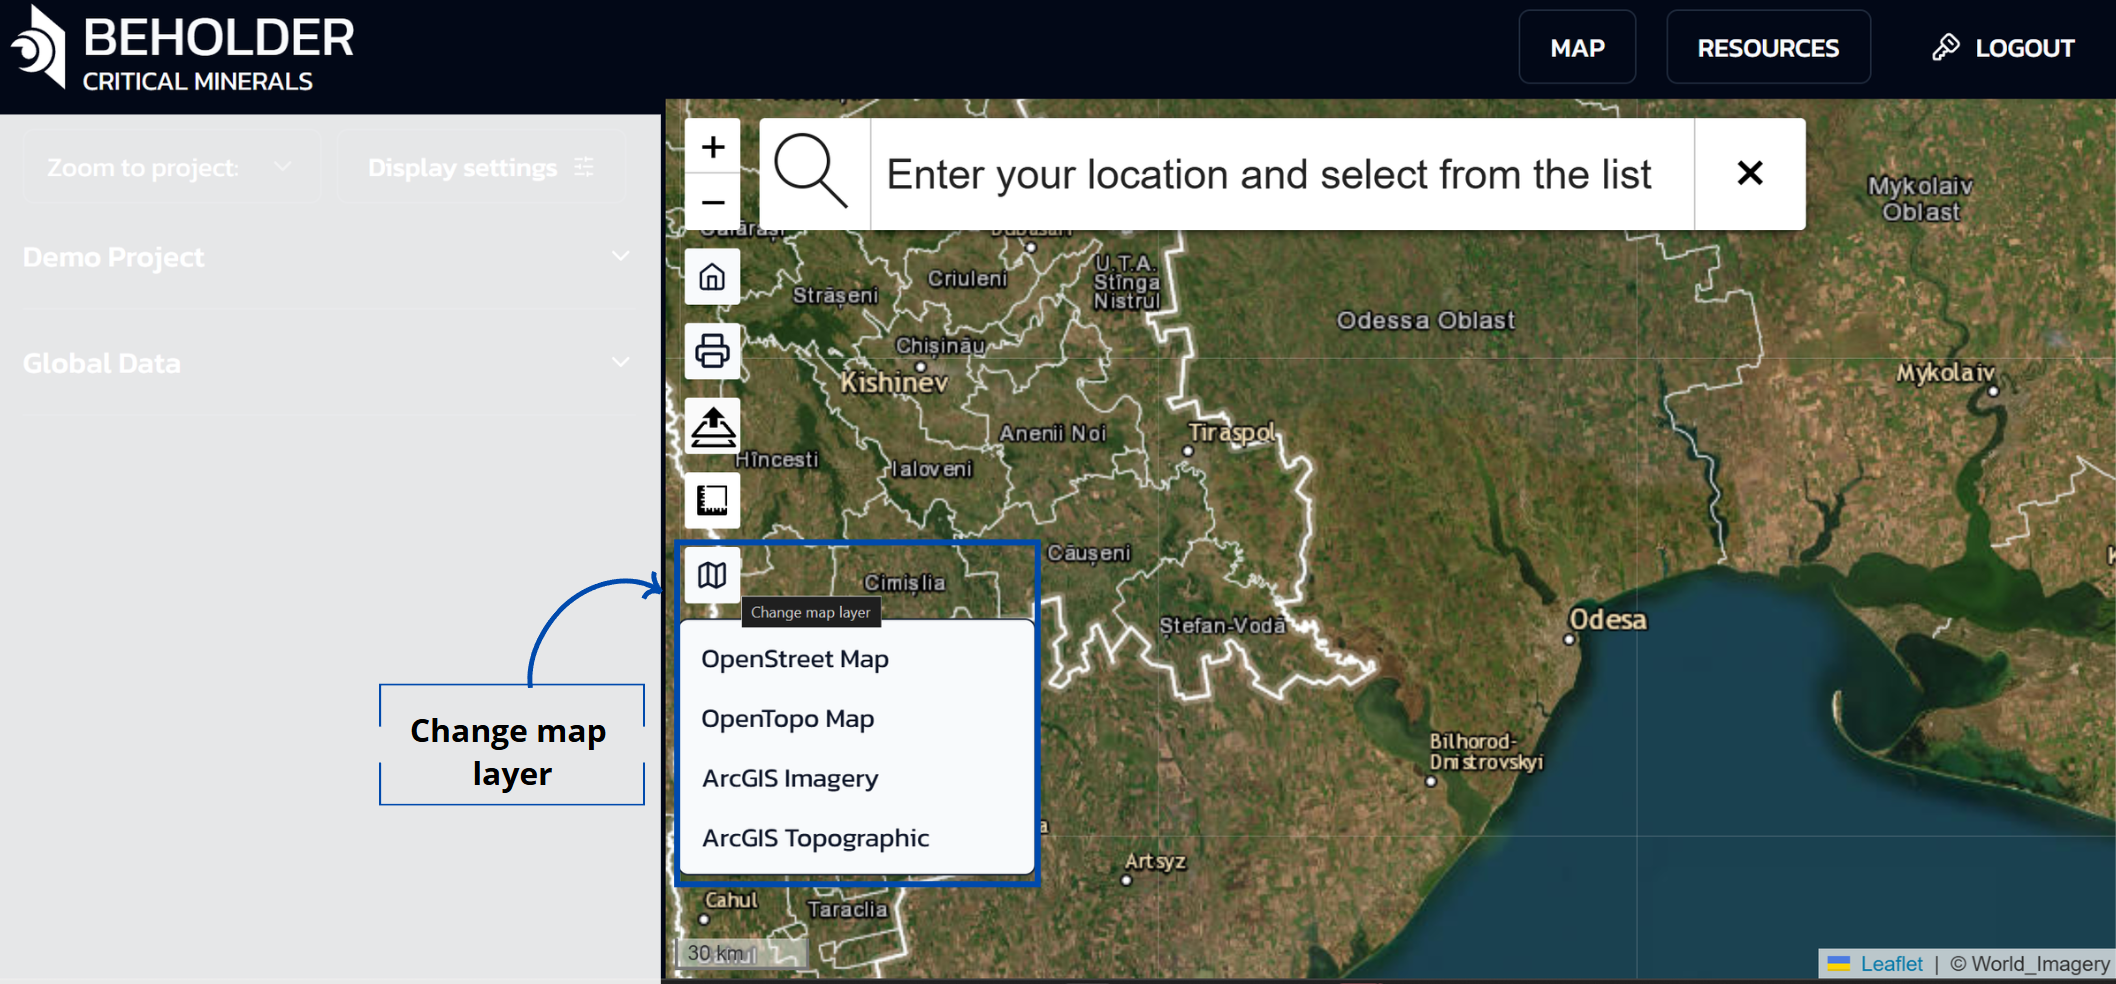
Available Basemaps
- OpenStreet Map - standard cartographic basemap with detailed road network and settlements
- OpenTopo Map - topographic map showing terrain relief and elevations
- ArcGIS Imagery - high-resolution satellite imagery
- ArcGIS Topographic - detailed topographic map from ArcGIS
Selecting a Basemap
- Change the map type through the layers button on the sidebar
- Basemaps can be changed at any time depending on the tasks and needs of the user
- Each type of basemap is optimized for different purposes: satellite imagery for detailed terrain study, topographic maps for relief analysis, standard maps for navigation
Custom Layer Import
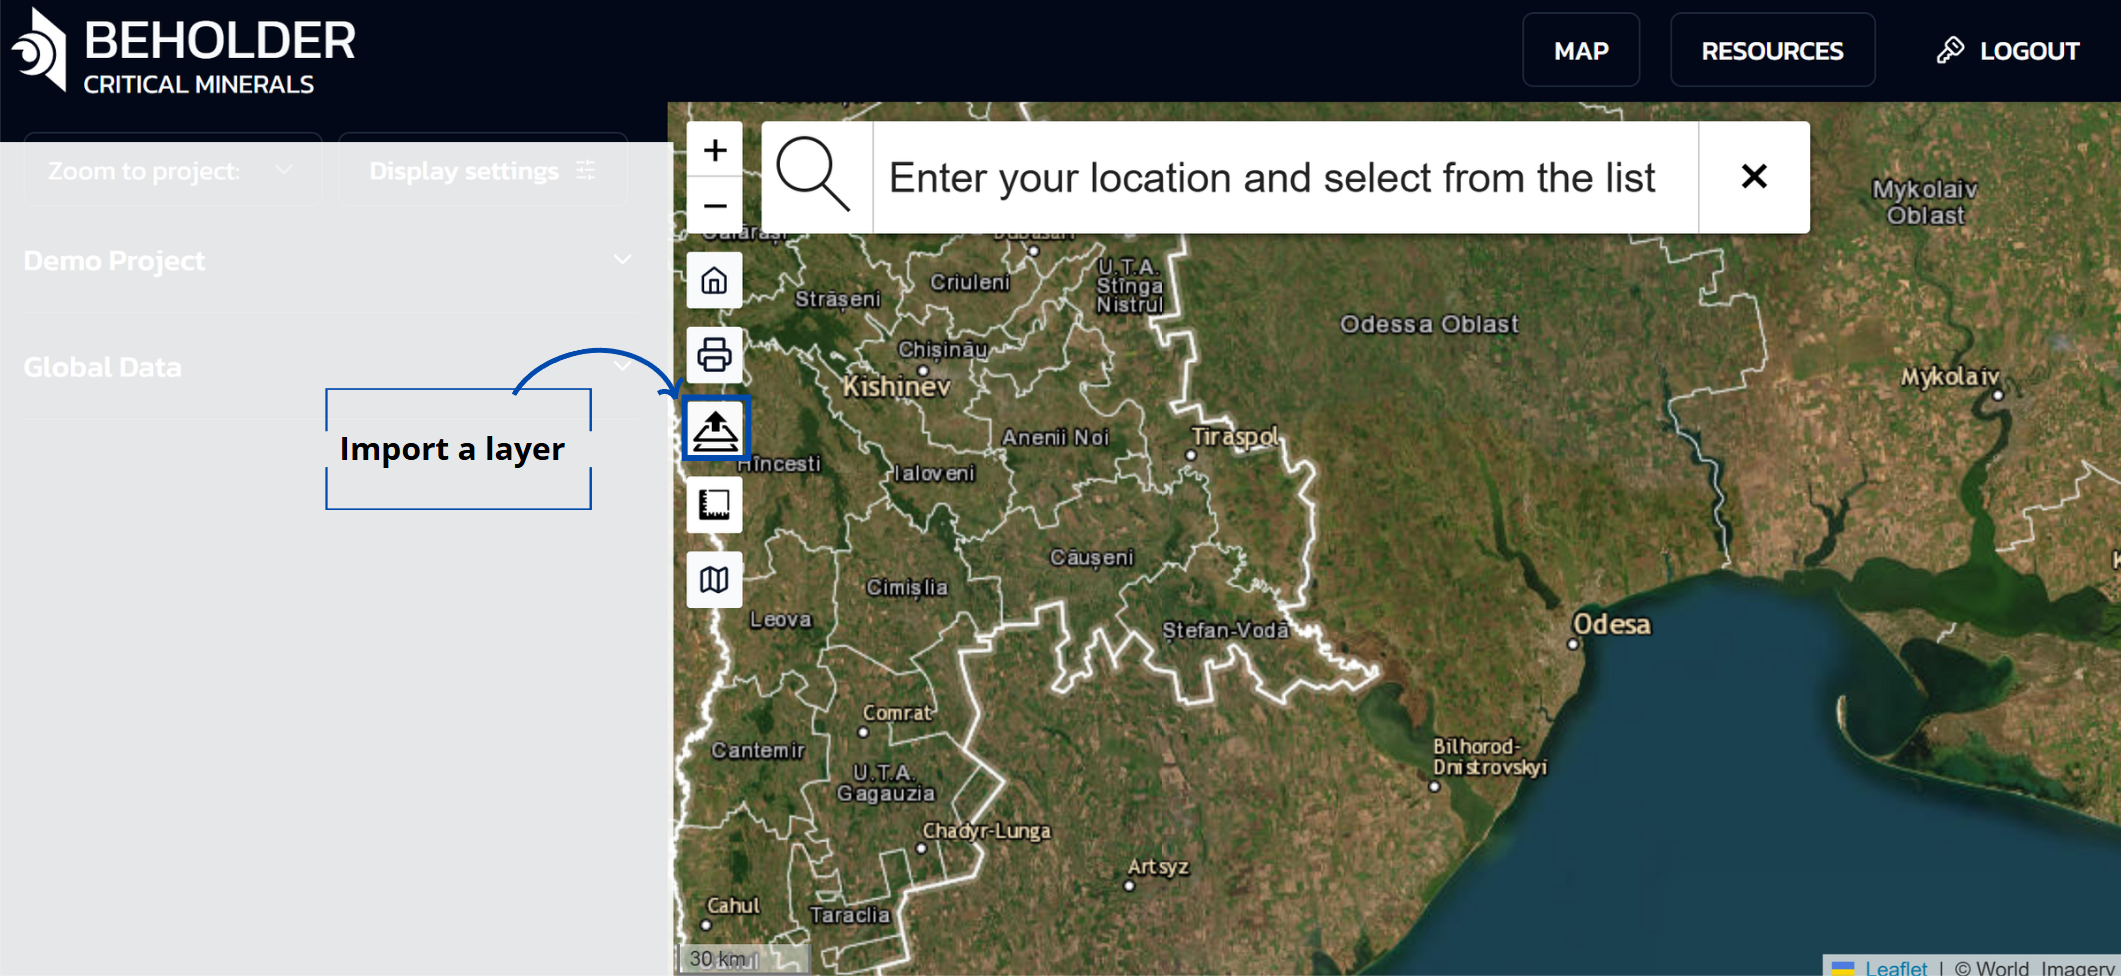
The layers button allows users to import their own geospatial data:
Layer Upload Function
- Access this feature through the layers button in the sidebar
- Import your own geographic data to overlay on top of the basemap
- Imported layers overlay on top of the selected basemap
- The application allows uploading vector geodata in various formats, including Shapefiles and GeoJSON
- All main geometry types are supported: point, line, and polygon objects
- Uploaded data must have correct geographic referencing (projection and coordinate system).For correct display, the layer must contain metadata about the coordinate system for proper positioning on the map. With missing or incorrect coordinate system, data may display with offset or not display at all.
Available Layer Types
Satellite Imagery
- Sentinel-2: 10-20m resolution multispectral imagery
- Landsat 8/9: 15-30m resolution thermal and multispectral
- MODIS: 250m-1km resolution vegetation and climate data
- Commercial Imagery: High-resolution commercial satellite data
Geological Data
- Geological Maps: Stratigraphic units and formations
- Structural Features: Faults, folds, and lineaments
- Mineral Occurrences: Known mineral deposits and showings
- Geophysical Data: Magnetic, gravity, and electromagnetic surveys
AI Predictions
- Mineral Probability: AI-predicted mineral potential
- Confidence Maps: Prediction confidence levels
- Mineral Types: Specific mineral predictions (lithium, graphite, etc.)
- Anomaly Detection: Statistical anomalies and hotspots
Environmental Data
- Topography: Digital elevation models and terrain
- Vegetation: NDVI and vegetation indices
- Climate: Temperature, precipitation, and weather data
- Hydrology: Rivers, lakes, and watershed boundaries
Layer Controls
Visibility Toggle
- Show/Hide: Click the eye icon to toggle layer visibility
- Opacity: Adjust layer transparency with the slider
- Order: Drag layers to change their display order
- Grouping: Organize layers into logical groups
Styling Options
- Color Schemes: Choose from multiple color palettes
- Symbols: Customize point and line symbols
- Labels: Control label display and formatting
- Classification: Adjust classification methods and breaks
Visualization Tools
Measurement Tool
Feature Overview
The area measurement tool allows users to determine the size of territories on the map. This functionality is valuable for evaluating land plots, route planning, geographic data analysis, and other tasks requiring precise spatial measurements.
Step-by-Step Instructions
Step 1: Activate the Measurement Tool
- Locate and click on the measurement icon (ruler symbol) in the side toolbar.
- The “Measure distances and areas” panel will appear.
Step 2: Create a New Measurement
- Click on the “Create a new measurement” button.
- The system will switch to measurement creation mode with the instruction “Start creating a measurement by adding points to the map”.
Step 3: Add Points to the Map
- Click on desired locations on the map to add polygon vertices.
- The system automatically connects points with lines.
- During measurement creation, the following information is displayed:
- Coordinates of the last point (in degrees and decimal format)
- Distance covered (in meters and kilometers)
- Current area of the selected region (in square meters and hectares)
Step 4: Complete the Measurement
- After adding all necessary points, click the “Finish measurement” button.
- The measurement will be saved on the map as a highlighted area.
Step 5: View Information About the Measured Area
- To view detailed information about the measured area, click on the area itself on the map.
- An information window will appear with the following data:
- Area in square meters and hectares
- Perimeter in meters and kilometers
- Additional options:
- For convenient viewing of the measured area, use the “Center on this area” option.
- Select an existing measurement and click the “Delete” button in the information window.
- At any stage of measurement creation, you can click the “Cancel” button to abort the process.
Notes
!!! tip “Measurement Accuracy” Measurement accuracy depends on the map scale and satellite image resolution.
!!! info “Best Practices” For more precise measurements, it is recommended to increase the map scale when adding points.
!!! note “Automatic Recalculation” The system automatically recalculates the area and perimeter when adding each new point.
Troubleshooting
Common Issues
- Measurement tool not responding: Refresh the page and try again.
- Unable to add points: Ensure you’re in measurement mode and the map is not locked.
- Inaccurate measurements: Zoom in closer to the area you’re measuring for better precision.
Print Function
Automatic Layout Creation
- When clicking the print button on the sidebar, a ready-to-print layout of the current map view is automatically created
- The layout includes all visible layers, measurements, and other elements displayed on the screen
- The system automatically optimizes the layout for standard print formats
- No additional setup is required by the user before sending to print
!!! tip “Print Quality” For higher quality prints, make sure all necessary layers are visible and properly configured before using the print function.
Map Interaction
Basic Operations
Viewing Information
- Left mouse button – clicking on a point displays an information window with detailed data about the selected object, including geographic coordinates, settlement name, administrative affiliation, and other available information
- This function allows users to quickly obtain reference information about objects of interest on the map without the need for additional searches
Map Navigation
- Moving – hold down the left mouse button and drag the map in the desired direction
- Changing scale – use the mouse wheel or the zoom buttons on the sidebar
!!! note “Keyboard Shortcuts” You can also use keyboard shortcuts: arrow keys for panning and +/- keys for zooming.
Layer Management
- Toggle visibility of individual layers
- Adjust layer order to control which features appear on top
- Remove layers when they are no longer needed
!!! danger “Data Loss Warning” Custom layers are not saved.
!!! question “Need Help?” If you have any questions, please refer to the FAQ tab.
Annotation Tools
Text Annotations
- Text Tool: Click the text icon
- Click Location: Click where you want to place text
- Enter Text: Type your annotation
- Formatting: Change font, size, and color
Point Markers
- Marker Tool: Click the pin icon
- Click Location: Place marker on map
- Add Description: Enter marker description
- Customize: Change marker style and color
Drawing Tools
- Freehand Drawing: Draw freehand lines and shapes
- Geometric Shapes: Draw circles, rectangles, and polygons
- Line Tools: Draw straight lines and polylines
- Arrow Tools: Add directional arrows and flow lines
Advanced Visualization
3D Visualization
- Terrain Display: View terrain in 3D perspective
- Layer Integration: Overlay geological data on 3D terrain
- Rotation: Rotate 3D view for different perspectives
- Elevation Exaggeration: Adjust vertical exaggeration
Time-Series Analysis
- Temporal Slider: Animate data over time
- Historical Data: View historical satellite imagery
- Change Detection: Identify changes over time
- Animation Controls: Play, pause, and control speed
Statistical Visualization
- Histograms: View data distribution histograms
- Scatter Plots: Analyze relationships between variables
- Box Plots: View statistical summaries
- Correlation Matrices: Analyze variable correlations
Data Export and Sharing
Export Options
Map Images
- PNG Export: High-resolution PNG images
- PDF Export: Vector-based PDF maps
- SVG Export: Scalable vector graphics
- Print Layout: Professional print layouts
Data Export
- Shapefile: Export vector data as shapefiles
- KML/KMZ: Export for Google Earth
- GeoTIFF: Export raster data as GeoTIFF
- CSV: Export attribute data as CSV
Report Generation
- Map Reports: Automated map reports
- Statistical Reports: Data analysis reports
- Custom Reports: User-defined report templates
- Batch Export: Export multiple maps at once
Sharing Features
- Public Links: Generate shareable map links
- Embed Codes: Embed maps in websites
- Social Sharing: Share on social media platforms
- Email Sharing: Send maps via email
Performance Optimization
Large Dataset Handling
- Data Clipping: Clip data to your area of interest
- Level of Detail: Adjust detail level for performance
- Caching: Enable data caching for faster loading
- Progressive Loading: Load data progressively
Browser Optimization
- Hardware Acceleration: Enable GPU acceleration
- Memory Management: Monitor memory usage
- Cache Settings: Optimize browser cache settings
- Network Optimization: Use stable internet connection
Customization Options
User Interface
- Theme Selection: Choose light or dark themes
- Layout Customization: Customize panel layout
- Toolbar Configuration: Add or remove toolbar tools
- Keyboard Shortcuts: Customize keyboard shortcuts
Map Styling
- Base Map Selection: Choose different base maps
- Color Schemes: Customize color schemes
- Font Settings: Adjust font sizes and styles
- Symbol Libraries: Use custom symbol libraries
Troubleshooting
Common Issues
- Slow Performance: Reduce data complexity or enable caching
- Missing Layers: Check layer visibility and data availability
- Export Problems: Ensure sufficient disk space and permissions
- Display Issues: Clear browser cache and refresh
Performance Tips
- Use Appropriate Scale: Zoom to appropriate scale for your data
- Limit Active Layers: Keep only necessary layers visible
- Optimize Data: Use compressed data formats when possible
- Regular Updates: Keep browser and platform updated
Best Practices
Map Design
- Clear Hierarchy: Use visual hierarchy to guide attention
- Appropriate Scale: Choose appropriate map scale
- Color Consistency: Use consistent color schemes
- Label Readability: Ensure labels are readable at all scales
Data Management
- Organize Layers: Group related layers logically
- Metadata: Maintain comprehensive layer metadata
- Version Control: Keep track of data versions
- Backup: Regularly backup your work
Collaboration
- Standardization: Use standard symbols and colors
- Documentation: Document your mapping decisions
- Sharing: Use appropriate sharing methods
- Feedback: Seek feedback from colleagues
Advanced Features
Custom Projections
- Coordinate Systems: Support for all major coordinate systems
- Projection Conversion: Convert between different projections
- Custom Projections: Define custom coordinate systems
- Datum Transformations: Handle datum transformations
Geoprocessing Tools
- Buffer Analysis: Create buffer zones around features
- Intersection Analysis: Find intersections between layers
- Union Operations: Combine multiple layers
- Clip Operations: Clip data to specific areas
Network Analysis
- Routing: Calculate optimal routes
- Service Areas: Define service areas around points
- Network Connectivity: Analyze network connectivity
- Accessibility Analysis: Measure accessibility to features
Integration with External Software
GIS Software
- ArcGIS: Direct integration with ArcGIS
- QGIS: Export data for QGIS analysis
- MapInfo: Support for MapInfo formats
- Global Mapper: Integration with Global Mapper
CAD Software
- AutoCAD: Export data for AutoCAD
- MicroStation: Support for MicroStation formats
- SketchUp: Export 3D data for SketchUp
- Blender: Export for 3D modeling
Database Systems
- PostgreSQL: Direct database connections
- Oracle Spatial: Oracle spatial database support
- SQL Server: Microsoft SQL Server integration
- MySQL: MySQL database connectivity
Conclusion
The interactive mapping system is the heart of the Beholder Portal, providing powerful tools for mineral exploration and geological analysis. By mastering these features, you’ll be able to create compelling visualizations, perform sophisticated analysis, and share your findings effectively.
Continue exploring the platform and don’t hesitate to experiment with different visualization options to find what works best for your specific needs.
AI Models and Machine Learning
The Beholder Portal leverages state-of-the-art machine learning models to predict mineral potential with unprecedented accuracy. This guide explains how our AI systems work and how to interpret their predictions.
Model Architecture
Deep Learning Framework
Our models are built using TensorFlow and PyTorch, utilizing:
- Convolutional Neural Networks (CNNs) for satellite imagery analysis
- Recurrent Neural Networks (RNNs) for temporal data processing
- Ensemble Methods combining multiple models for improved accuracy
- Transfer Learning from pre-trained geological models
Input Data Sources
The models process multiple data types:
-
Satellite Imagery
- Sentinel-2 multispectral data
- Landsat 8/9 thermal and multispectral
- MODIS vegetation indices
- High-resolution commercial imagery
-
Geological Data
- Geological survey maps
- Soil composition data
- Rock type classifications
- Mineral occurrence databases
-
Geophysical Data
- Magnetic field measurements
- Gravity data
- Electromagnetic surveys
- Seismic data
-
Environmental Data
- Climate variables
- Vegetation indices
- Topographic data
- Hydrological features
Mineral-Specific Models
Lithium Prediction Model
- Accuracy: 94.2% on validation data
- Key Features: Spectral signatures, geological context, environmental factors
- Output: Probability maps with confidence intervals
- Update Frequency: Monthly with new satellite data
Graphite Detection Model
- Accuracy: 91.8% on validation data
- Key Features: Carbon content indicators, geological formations
- Output: Binary classification with confidence scores
- Update Frequency: Bi-weekly
Rare Earth Elements (REE) Model
- Accuracy: 89.5% on validation data
- Key Features: Complex geological indicators, multi-element analysis
- Output: Multi-class predictions for different REE types
- Update Frequency: Monthly
Copper and Base Metals Model
- Accuracy: 92.1% on validation data
- Key Features: Ore deposit indicators, geological structures
- Output: Continuous probability maps
- Update Frequency: Weekly
Model Training Process
Data Preparation
- Data Collection: Aggregating data from multiple sources
- Quality Control: Automated and manual data validation
- Feature Engineering: Creating relevant input features
- Data Augmentation: Synthetic data generation for rare cases
Training Methodology
- Cross-Validation: 5-fold cross-validation for robust evaluation
- Hyperparameter Tuning: Automated optimization using Bayesian methods
- Regularization: L1/L2 regularization to prevent overfitting
- Early Stopping: Preventing overtraining with validation monitoring
Validation and Testing
- Holdout Set: 20% of data reserved for final testing
- Temporal Validation: Testing on future data to ensure generalization
- Spatial Validation: Testing across different geographical regions
- Mineral-Specific Validation: Separate validation for each mineral type
Prediction Interpretation
Confidence Scores
- High Confidence (80-100%): Strong geological indicators present
- Medium Confidence (60-80%): Moderate indicators, requires verification
- Low Confidence (40-60%): Weak indicators, high uncertainty
- Very Low Confidence (<40%): Insufficient data or conflicting indicators
Uncertainty Quantification
Our models provide uncertainty estimates through:
- Monte Carlo Dropout: Multiple forward passes with dropout
- Ensemble Variance: Variance across different model predictions
- Bayesian Neural Networks: Probabilistic weight distributions
Feature Importance
Understanding which factors drive predictions:
- Spectral Features: Most important for satellite-based detection
- Geological Context: Critical for understanding mineral formation
- Environmental Factors: Important for surface mineral detection
- Temporal Patterns: Seasonal variations in detection accuracy
Model Performance Metrics
Accuracy Metrics
- Overall Accuracy: 92.3% across all mineral types
- Precision: 89.7% (true positives / predicted positives)
- Recall: 91.2% (true positives / actual positives)
- F1-Score: 90.4% (harmonic mean of precision and recall)
Spatial Performance
- Regional Variation: 88-96% accuracy across different geological regions
- Scale Dependency: Better performance at larger scales (>1km²)
- Terrain Sensitivity: Reduced accuracy in heavily forested areas
Temporal Performance
- Seasonal Variation: 2-5% accuracy variation across seasons
- Weather Impact: Cloud cover reduces accuracy by 3-8%
- Data Freshness: Predictions improve with newer satellite data
Continuous Improvement
Model Updates
- Incremental Learning: Models update with new data
- A/B Testing: New model versions tested against current models
- User Feedback: Incorporating expert geological feedback
- Performance Monitoring: Continuous accuracy tracking
Data Integration
- New Satellite Missions: Integration of new data sources
- Improved Resolution: Higher resolution imagery as available
- Additional Sensors: Integration of new sensor types
- Ground Truth Data: Incorporation of field validation data
Best Practices for Users
Interpreting Predictions
- Always consider confidence scores
- Cross-reference with geological knowledge
- Use multiple mineral models for comprehensive analysis
- Validate predictions with field data when possible
Optimizing Results
- Use appropriate spatial resolution for your needs
- Consider seasonal variations in predictions
- Combine with traditional geological methods
- Regularly update your analysis with new data
Technical Specifications
Computational Requirements
- Processing Time: 2-5 minutes per 100km² area
- Memory Usage: 4-8GB RAM for large area analysis
- Storage: 1-2GB per 100km² processed area
- Network: High-speed internet recommended for large datasets
API Access
- RESTful API: Programmatic access to model predictions
- Rate Limits: 1000 requests per hour for standard accounts
- Data Formats: JSON, GeoTIFF, NetCDF output formats
- Authentication: OAuth 2.0 and API key support
Future Developments
Upcoming Features
- Real-time Processing: Sub-minute prediction updates
- Mobile Integration: Smartphone app for field use
- 3D Visualization: Three-dimensional geological models
- Advanced Analytics: Predictive modeling for exploration success
Research Collaborations
- University Partnerships: Ongoing research collaborations
- Industry Cooperation: Joint development with mining companies
- Open Source Components: Contributing to open-source geological AI
- Standards Development: Participating in industry standards
For technical support or questions about our AI models, please contact our data science team through the support portal.
User Guide for Geologists
📖 User Guide
Master the Beholder platform with our comprehensive guide
🌍 Platform Overview
The Beholder Critical Minerals platform is a professional GIS system designed specifically for geological data analysis and critical minerals exploration. This specialized geoportal combines high-resolution mapping capabilities with comprehensive geological datasets to support mining and exploration industries.
    <div class="key-features">
        <div class="feature">
            <div class="feature-icon">🗺️</div>
            <h3>Advanced GIS</h3>
            <p>Professional-grade geological information system</p>
        </div>
        <div class="feature">
            <div class="feature-icon">💎</div>
            <h3>Critical Minerals</h3>
            <p>Specialized tools for mineral exploration</p>
        </div>
        <div class="feature">
            <div class="feature-icon">📊</div>
            <h3>Data Analysis</h3>
            <p>Comprehensive geological datasets</p>
        </div>
        <div class="feature">
            <div class="feature-icon">🚀</div>
            <h3>High Performance</h3>
            <p>Optimized for large-scale operations</p>
        </div>
    </div>
</div>
🏗️ Interface Structure
The platform interface is thoughtfully organized into three main components, each designed to provide intuitive access to specific functionalities:
Top Navigation Bar
Quick access to main functions, user account, and system settings
Learn More →<a href="/wiki/interactive-maps" class="component-card">
<div class="component-number">2</div>
<div class="component-content">
<h3>Left Sidebar</h3>
<p>Layer management, search tools, and data filters</p>
<span class="component-link">Learn More →</span>
</div>
</a>
<a href="/wiki/interactive-maps" class="component-card">
<div class="component-number">3</div>
<div class="component-content">
<h3>Main Map Area</h3>
<p>Interactive geological map with visualization tools</p>
<span class="component-link">Learn More →</span>
</div>
</a>🖥️ Platform Interface Overview
Getting Started as a Geologist
Professional Account Setup
- Account Registration: Sign up with your professional credentials
- Verification: Submit geological qualifications for verification
- Profile Configuration: Set up your specialization areas and interests
- Team Access: Invite team members and collaborators
Initial Platform Tour
- Interactive Tutorial: 15-minute guided tour of geological features
- Sample Projects: Access to example exploration projects
- Data Import: Learn how to upload your existing geological data
- Tool Overview: Introduction to geological analysis tools
Geological Analysis Tools
Map Visualization
The portal provides multiple visualization modes:
Geological Map Overlay
- Stratigraphic Units: Display geological formations and rock units
- Structural Features: Show faults, folds, and other structural elements
- Mineral Occurrences: Plot known mineral deposits and occurrences
- Custom Layers: Upload and display your own geological maps
Satellite Imagery Analysis
- Multispectral Bands: Analyze different spectral bands for geological features
- False Color Composites: Create custom band combinations for mineral detection
- Temporal Analysis: Compare imagery across different time periods
- Resolution Options: Switch between different spatial resolutions
Mineral Prediction Tools
AI Mineral Predictions
- Confidence Mapping: Visualize prediction confidence across your area of interest
- Mineral Type Selection: Focus on specific minerals relevant to your project
- Probability Thresholds: Adjust sensitivity for different exploration phases
- Uncertainty Analysis: Understand model limitations and uncertainties
Geological Context Integration
- Formation Analysis: Correlate predictions with geological formations
- Structural Controls: Analyze how structural features influence mineralization
- Alteration Mapping: Identify hydrothermal alteration zones
- Weathering Effects: Account for surface weathering in predictions
Data Analysis and Interpretation
Statistical Analysis
- Spatial Statistics: Calculate spatial correlation and clustering
- Probability Analysis: Statistical assessment of mineral potential
- Trend Analysis: Identify regional trends and patterns
- Anomaly Detection: Find statistically significant anomalies
Cross-Validation Tools
- Field Data Integration: Compare predictions with field observations
- Drill Hole Analysis: Validate predictions against drilling results
- Sample Analysis: Integrate geochemical and petrographic data
- Historical Data: Compare with known mineral occurrences
Workflow Integration
Project Management
- Project Creation: Set up new exploration projects
- Area Definition: Define your area of interest and boundaries
- Data Organization: Organize geological data by project
- Team Collaboration: Share projects with team members
- Version Control: Track changes and maintain project history
Data Import and Export
- Supported Formats: Shapefile, KML, GeoTIFF, NetCDF, CSV
- Coordinate Systems: Support for all major coordinate systems
- Data Validation: Automatic validation of geological data
- Metadata Preservation: Maintain geological metadata and attributes
Report Generation
- Automated Reports: Generate standard geological reports
- Custom Templates: Create custom report templates
- Map Production: High-quality map production for publications
- Data Tables: Export geological data in various formats
Advanced Geological Features
Stratigraphic Analysis
- Formation Mapping: Map and analyze geological formations
- Correlation: Correlate formations across different areas
- Thickness Analysis: Calculate and visualize formation thicknesses
- Depositional Environment: Analyze depositional environments
Structural Geology
- Fault Analysis: Map and analyze fault systems
- Fold Analysis: Identify and analyze fold structures
- Lineament Analysis: Detect and analyze linear features
- Stress Analysis: Analyze stress fields and deformation
Geochemical Integration
- Sample Data: Import and analyze geochemical samples
- Contour Mapping: Create geochemical contour maps
- Anomaly Detection: Identify geochemical anomalies
- Statistical Analysis: Perform statistical analysis on geochemical data
Petrographic Analysis
- Thin Section Data: Integrate petrographic observations
- Mineral Identification: AI-assisted mineral identification
- Texture Analysis: Analyze rock textures and fabrics
- Alteration Mapping: Map alteration assemblages
Best Practices for Geologists
Data Quality
- Data Validation: Always validate imported geological data
- Metadata Documentation: Maintain comprehensive metadata
- Quality Control: Implement quality control procedures
- Version Management: Keep track of data versions and updates
Interpretation Guidelines
- Multi-Scale Analysis: Analyze at multiple scales
- Cross-Validation: Validate AI predictions with geological knowledge
- Uncertainty Assessment: Always consider prediction uncertainties
- Field Verification: Plan field verification of predictions
Collaboration
- Team Communication: Use built-in communication tools
- Data Sharing: Share relevant data with team members
- Review Process: Implement peer review processes
- Documentation: Maintain comprehensive project documentation
Case Studies
Lithium Exploration in Nevada
- Project Overview: 500km² lithium exploration project
- AI Predictions: 94% accuracy in identifying lithium-bearing clays
- Field Validation: 87% of high-confidence predictions confirmed
- Economic Impact: 40% reduction in exploration costs
Graphite Exploration in Canada
- Project Overview: 200km² graphite exploration project
- Geological Context: Integration with Precambrian geology
- AI Results: 91% accuracy in graphite detection
- Drilling Results: 78% success rate in drilling AI-identified targets
Rare Earth Elements in Australia
- Project Overview: 1000km² REE exploration project
- Complex Geology: Integration with igneous and metamorphic rocks
- AI Performance: 89% accuracy across multiple REE types
- Resource Estimation: Improved resource estimation accuracy
Training and Support
Educational Resources
- Video Tutorials: Step-by-step video guides
- Webinars: Regular webinars on geological applications
- Documentation: Comprehensive technical documentation
- Best Practices: Industry best practices and guidelines
Technical Support
- Geological Support: Dedicated geological support team
- Technical Issues: 24/7 technical support
- Feature Requests: Submit requests for new features
- User Community: Connect with other geologists using the platform
Professional Development
- Certification Programs: Professional certification in AI-assisted exploration
- Workshops: Hands-on workshops and training sessions
- Conferences: Annual user conferences and meetings
- Research Collaboration: Opportunities for research collaboration
Integration with External Software
GIS Software
- ArcGIS Integration: Direct integration with ArcGIS
- QGIS Support: Export data for QGIS analysis
- MapInfo Compatibility: Support for MapInfo formats
- Custom GIS: API access for custom GIS applications
Geological Software
- Leapfrog Integration: Export data for 3D modeling
- Surpac Support: Integration with Surpac geological software
- Datamine Compatibility: Support for Datamine formats
- Custom Tools: API access for custom geological tools
Future Developments
Upcoming Features
- 3D Geological Modeling: Three-dimensional geological visualization
- Machine Learning Training: Tools for training custom models
- Advanced Analytics: Enhanced statistical and analytical tools
- Mobile Field Tools: Mobile applications for field data collection
Research Opportunities
- Collaborative Research: Opportunities for research collaboration
- Data Sharing: Access to anonymized exploration data
- Model Development: Participate in model development
- Publication Support: Support for academic publications
For additional support or questions specific to geological applications, please contact our geological support team at geology@beholder.earth.
Resources Management
📚 Resources Management Center
Comprehensive data layer management with tabular interface for efficient geospatial resource access and exploration.
The Resources tab serves as your central hub for managing all available data layers, providing a structured tabular view for efficient navigation, metadata access, and resource exploration without cluttering your main workspace.
📋 Main Table Interface
🗃️ Comprehensive Layer Organization
All available layers displayed in a clear tabular structure for streamlined data management and quick access to geospatial resources.
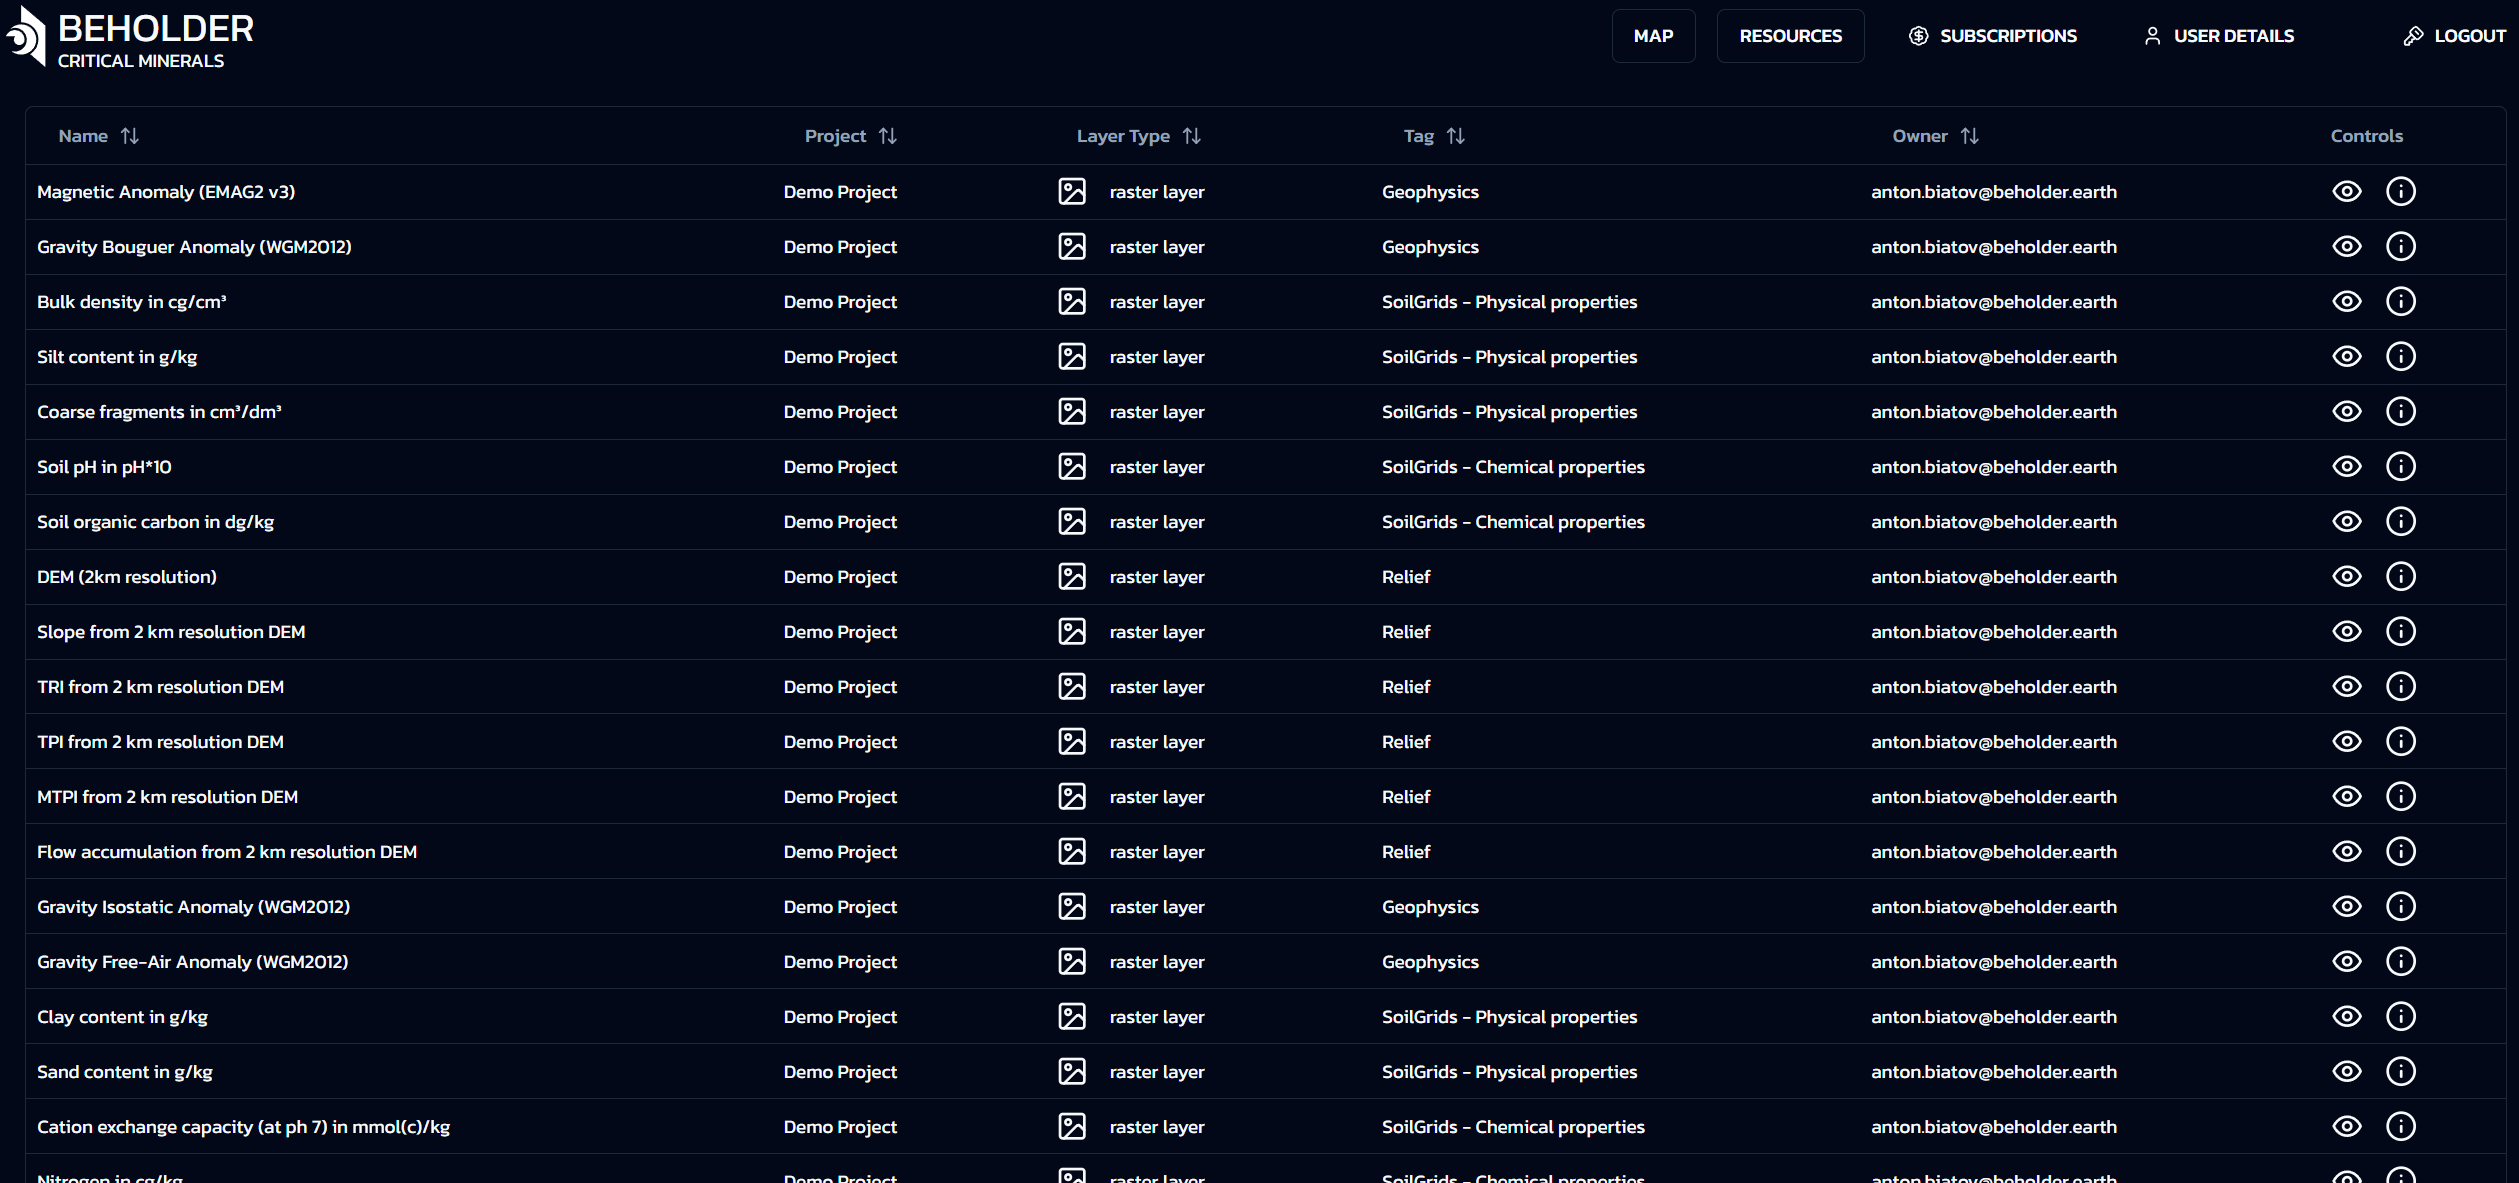
📊 Table Column Structure
| Column | Description | Purpose |
|---|---|---|
| 📁 Project | The name of the project the resource belongs to | Project identification and grouping |
| 🏷️ Tag | Tag name corresponding to folder in layer tree on “Map” tab | Hierarchical organization reference |
| 📝 Name | The descriptive name of the specific layer or resource | Layer identification and description |
| 🔧 Type | Layer type classification: Raster or Vector | Data format identification |
| 👤 Owner | User who owns or created the layer resource | Ownership and access rights |
| 🎛️ Controls | Buttons for additional layer exploration tools | Access to analysis and preview tools |
ℹ️ Table Organization Benefits
- Clear project-based resource grouping
- Direct correspondence with Map tab layer tree
- Instant layer type identification
- Quick ownership and access verification
- One-click access to exploration tools
🎛️ Control Buttons System
🔧 Advanced Layer Exploration Tools
Comprehensive control system providing immediate access to layer analysis, preview, and data exploration capabilities.
ℹ️ Layer Info Tool
- Purpose: Access detailed layer metadata and properties
- Features:
- Complete layer information display
- Data source and creation details
- Technical specifications and parameters
- Usage statistics and access history
👁️ Layer Preview Tool
- Purpose: Visual preview of layer content without full loading
- Features:
- Quick visual assessment of layer data
- Thumbnail preview generation
- Data quality and coverage verification
- Style and rendering preview
📊 Data Table Tool
- Purpose: Tabular data exploration and analysis
- Features:
- Attribute table viewing
- Data filtering and sorting
- Statistical analysis tools
- Export capabilities
⚠️ Note: Data Table tool is available only for vector layers. Raster layers will show a “Not available” message as they don’t contain tabular data.
🎯 Resource Management Benefits
🔍 Enhanced Data Discovery
- Quick Resource Identification: Instantly locate and identify relevant data layers
- Efficient Search and Filtering: Find specific resources based on project, type, or ownership
- Metadata Access: Comprehensive information about each layer’s properties and source
📋 Streamlined Workflow
- Centralized Management: All resources in one organized interface
- Project Organization: Clear grouping by project for better resource management
- Access Control: Easy identification of resource ownership and permissions
👁️ Visual Data Assessment
- Preview Capabilities: Quick visual assessment without full data loading
- Quality Verification: Immediate data quality and coverage evaluation
- Style Preview: See how layers will appear before adding to map
⚡ Performance Optimization
- Efficient Loading: Preview and metadata access without heavy data processing
- Resource Planning: Better understanding of data requirements before map integration
- Workflow Efficiency: Reduced time spent on data discovery and assessment
💡 Best Practices
- Use the table filters to quickly find resources by project or type
- Preview layers before adding them to your map to ensure they meet your needs
- Check layer metadata to understand data sources and quality
- Organize resources by project for better workflow management
- Use the data table tool for vector layers to explore attribute data
🔗 Related Documentation
- Interactive Maps Guide - Learn about map visualization and layer management
- Quick Start Guide - Get started with the platform
- For Geologists - Professional geological analysis tools
Get in TOUCH
Contact Information
Your email address is safe with us. Required fields are noted with *
Get In Touch
Let us know how we could help.
Email Address:
team@beholder.earth
Address
PAE TN 25-47, LASNAMÄE LINNAOSA, 11414 TALLINN, HARJU MAAKOND